Are Testosterone Levels Declining?
Are testosterone levels declining? Yes—testosterone levels appear to be declining in many male populations, even after age is taken into account. Our evidence map found that 6 of 8 direct population comparisons supported a decline in total or free testosterone, 1 was mixed because BMI changed the result, and 1 found no decline. A 2025 systematic review covering 1,064,891 healthy men reached the same broad conclusion. But the evidence does not support one global percentage, and the widely reported 54% drop cannot be rebuilt from the available 2026 conference abstract alone.
“Across eight direct population comparisons from six countries, six support a decline, one is BMI-sensitive, and one found no decline. The evidence points to a real population trend, not one universal decline rate.”
— TRT Provider Guide Testosterone Trend Evidence Map, version 1.1; verified September 3, 2026
| Measure | Finding |
|---|---|
| Direct population comparisons reviewed | 8 |
| Comparisons supporting a decline | 6 of 8 — 75.0% |
| BMI-sensitive or mixed result | 1 of 8 — 12.5% |
| Result finding no decline | 1 of 8 — 12.5% |
| Countries represented in the direct evidence map | 6 |
| Earliest to latest collection year | 1972–2019 |
| Men in the 2025 full systematic review | 1,064,891 |
| Newest pooled total-testosterone estimate | −0.26 nmol/L per year, conference abstract only |
Source: TRT Provider Guide Testosterone Trend Evidence Map, version 1.1, built from the eight original studies in Table 4 and the two syntheses in Table 3. The 6/1/1 result is our direction count, not a pooled effect estimate.
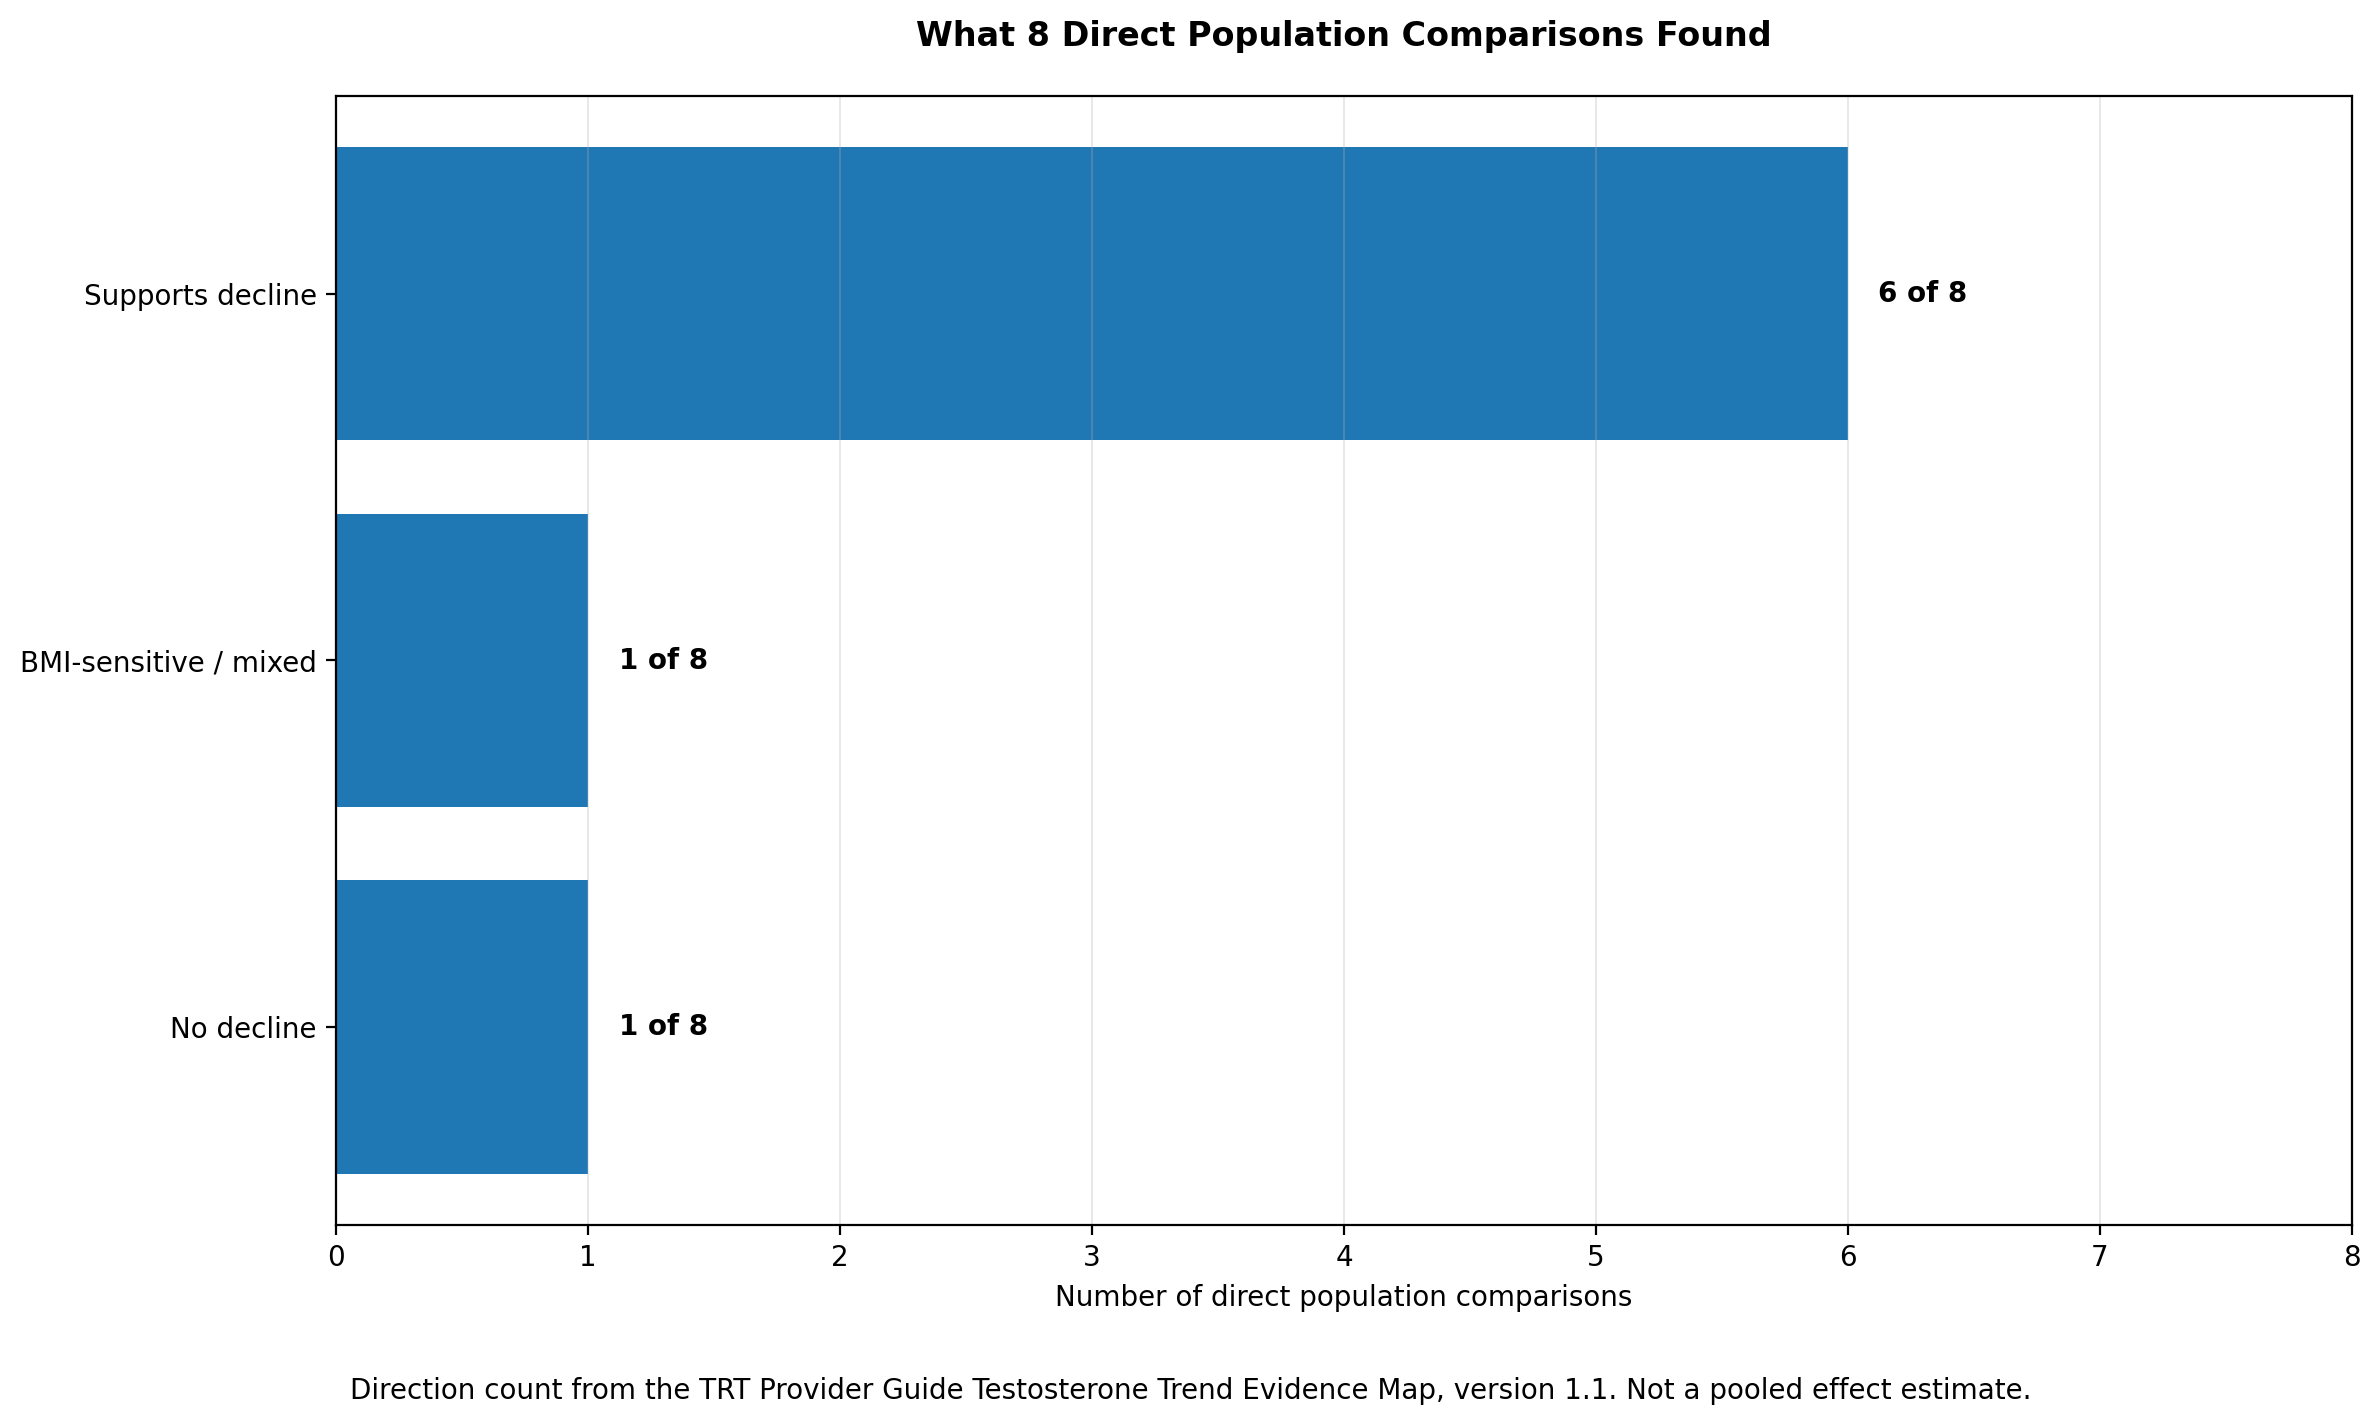
What this shows: Men of the same age often had lower testosterone when tested in later years. The pattern appears in several countries and study designs.
What this does not show: It does not prove that every man’s testosterone is falling. It does not give one safe worldwide percentage. It does not prove one cause. And it cannot diagnose low testosterone in one person.
By TRT Provider Guide
Last verified and updated: September 3, 2026
Dataset version: 1.1
Page disclosure: No affiliate links, provider promotions, treatment offers, or paid recommendations appear on this page.
Are testosterone levels declining?
The best answer is yes, with important limits. Six of eight direct population comparisons found lower total or free testosterone in later groups after age was matched, split, or adjusted. One Danish result became non-significant after BMI adjustment, while one nationally representative U.S. comparison found no decline.
A useful way to read this field is as an evidence ladder. The steps answer slightly different questions.
| Evidence layer | Records on this page | Main finding | What it can tell us |
|---|---|---|---|
| Direct age-matched, age-stratified, or age-adjusted population comparisons | 8 | 6 decline, 1 mixed, 1 no decline | Whether similar-age male groups tested in later years tended to have lower testosterone |
| Same-men longitudinal support | 1 | Men with stable or lower weight still averaged a 117 ng/dL, or 19%, fall over 20 years | Whether weight gain alone explains a long fall within one cohort; aging and calendar time still overlap |
| Full systematic review of published healthy-male study groups | 1 | A negative time trend remained after adjustment in a review of 1,064,891 men | Whether the broad published literature shifts downward over time |
| Systematic review and meta-trend conference abstract | 1 | Total testosterone fell 0.26 nmol/L per year across the included data | A preliminary pooled annual estimate that needs a full paper for complete audit |
Source: TRT Provider Guide evidence classification; Mazur et al. 2013; Santi et al. 2025; Levy et al. 2026.
The key term is secular decline. Here, “secular” does not mean nonreligious. It means a change across calendar time or birth groups after normal aging is taken into account.
Three hormone terms also matter:
- Total testosterone is all testosterone measured in the blood, including hormone attached to proteins.
- Free testosterone is the small share that is not bound to a protein.
- Sex hormone-binding globulin, or SHBG, is one of the main proteins that carries testosterone.
Definitions: Endocrine Society glossary.
Total and free testosterone can move in different ways when SHBG changes. That is one reason a simple “testosterone is down by X%” claim can hide more than it explains.
What does the newest research show?
The newest full systematic review supports a real downward trend, while the newest pooled rate is still preliminary. The 2025 review included more than one million men and found lower testosterone in later study years after several adjustments. The 2026 result is an official conference abstract, not a full paper, so its annual estimate should be labeled that way.
| Source | Evidence included | Main result | Strongest reason to trust it | Main reason for caution |
|---|---|---|---|---|
| Santi et al., 2025 full systematic review | 1,256 papers, 1,504 study groups, 1,064,891 healthy men; publications from January 1, 1970; database search through July 10, 2024 | Testosterone fell over study years. The trend remained in a model using study size, age, BMI, and assay type; BMI was available for 742 of 1,504 groups in that model | Full peer-reviewed paper with broad coverage and several sensitivity analyses | It used study-group averages, not one harmonized person-level dataset; designs and assays differed, and BMI was missing for about half of the groups |
| Levy et al., 2026 conference abstract | 8,656 records screened, 12 studies, 40 data points, 7 countries, 102,334 participants; data years 1972–2019 | Total testosterone −0.26 nmol/L/year; free testosterone −4.13 pmol/L/year; SHBG −0.16 nmol/L/year | Direct meta-trend design with annual change calculated within age groups | Abstract only; limited methods and tables; mostly high-income settings; the published sample count conflicts with news reports |
Source: Santi et al. 2025 and the official Human Reproduction abstract by Levy et al. 2026.
The two syntheses agree on total testosterone, but not on SHBG. The 2025 review found no clear SHBG time trend across 489 study groups and 312,498 men (p=0.453), while the 2026 abstract reported SHBG falling 0.16 nmol/L per year (p<0.0001). Different inclusion rules and models may help explain the gap, but the full 2026 paper is needed for a fair side-by-side audit.
The 2025 review is broad. It looked at published averages from healthy male groups, not only studies designed to test a secular decline. Its main time trend was significant, with a reported p value of 0.033. The result also remained in a model that used study size, age, BMI, and test method.
But one result deserves special attention. The review did not find a significant decline in the subgroup that used mass spectrometry, a more specific laboratory method. That subgroup had little early evidence: only 5 of 117 mass-spectrometry papers, covering 8 study groups, came from before 2000. The null result may reflect a real method difference, too little early data, or both. It does not settle the question by itself.
The 2026 abstract used a narrower design. It included studies that measured adult men from similar populations across at least two years. It reported a total-testosterone fall of 0.17 nmol/L per year in studies with a median sampling year before 2000 and 0.33 nmol/L per year after 2000.
That apparent acceleration is important. It is also not final. A full paper would need to show the included studies, weights, model choices, baseline levels, sensitivity tables, and treatment of lab-method changes before readers can fully audit the estimate.
How did we build the Testosterone Trend Evidence Map?
Version 1.1 contains 11 verified research records: 8 direct population comparisons, 1 supporting longitudinal study, and 2 current syntheses. We read the original report or official publisher record for every row, recorded the study years, sample, hormone measure, age method, BMI result, assay warning, and largest limit, then applied a fixed direction rule. We did not pool the eight direct studies into a homemade global rate.
The question
We asked:
When males of the same age, age group, or age-adjusted population were tested in different calendar years, did total or free testosterone change?
The inclusion rule
A study entered the eight-study direct table when it met all of these rules:
- It reported original human data.
- It compared male testosterone across at least two calendar periods or birth groups.
- It handled age through matching, age groups, statistical adjustment, or a repeated population of similar age.
- It reported enough detail to classify the direction of the finding.
- It studied a population time trend, not only treatment response or ordinary aging.
We kept Mazur’s same-men veteran study as supporting evidence rather than placing it in the direct count. We kept the 2025 review and 2026 meta-trend abstract in a separate synthesis layer so their participants were not counted again.
The classification rule
| Code | Rule | Records |
|---|---|---|
| Supports decline | The age-handled comparison found lower total or free testosterone in the later period or birth group | 6 |
| BMI-sensitive / mixed | The total-testosterone trend changed after BMI adjustment, or total and free testosterone gave materially different answers | 1 |
| No decline | The adjusted comparison found no significant total- or free-testosterone decline | 1 |
Source: TRT Provider Guide classification rules applied to the eight original studies in Table 4.
The calculations
We used only simple, reproducible arithmetic:
- Percent lower = (earlier value − later value) ÷ earlier value × 100
- Testosterone unit conversion: 1 nmol/L ≈ 28.84 ng/dL
- Count shares = category count ÷ eight direct comparisons × 100
We label source-reported figures and our calculations separately. We rounded percentages to one decimal place unless more precision would change the meaning.
The source hierarchy
We used the original journal article, official journal abstract, PubMed record, or official medical and laboratory guidance. A news report appears only in the 54% claim audit because it is the source of that public claim, not evidence that the biological claim is true.
Original analyses on this page
The following counts, checks, and classifications are our own structured analyses. They did not appear together in any one source before this page:
- the 6/1/1 direction count across eight direct comparisons;
- the 4/1/1/2 BMI-sensitivity audit;
- the direct-study table with the main number and main caution in the same row;
- the separation of 8 direct comparisons, 1 supporting longitudinal study, and 2 syntheses;
- the 16,259-participant mismatch in the 54% source trail;
- the 22.63 to 10.41 nmol/L linear reconstruction needed for a 54% drop from the abstract’s stated overall slope;
- the explicit record of which values were reported and which were calculated.
These are structured findings, not new biological experiments. Anyone can reproduce them from the cited sources and rules above.
Evidence-map files
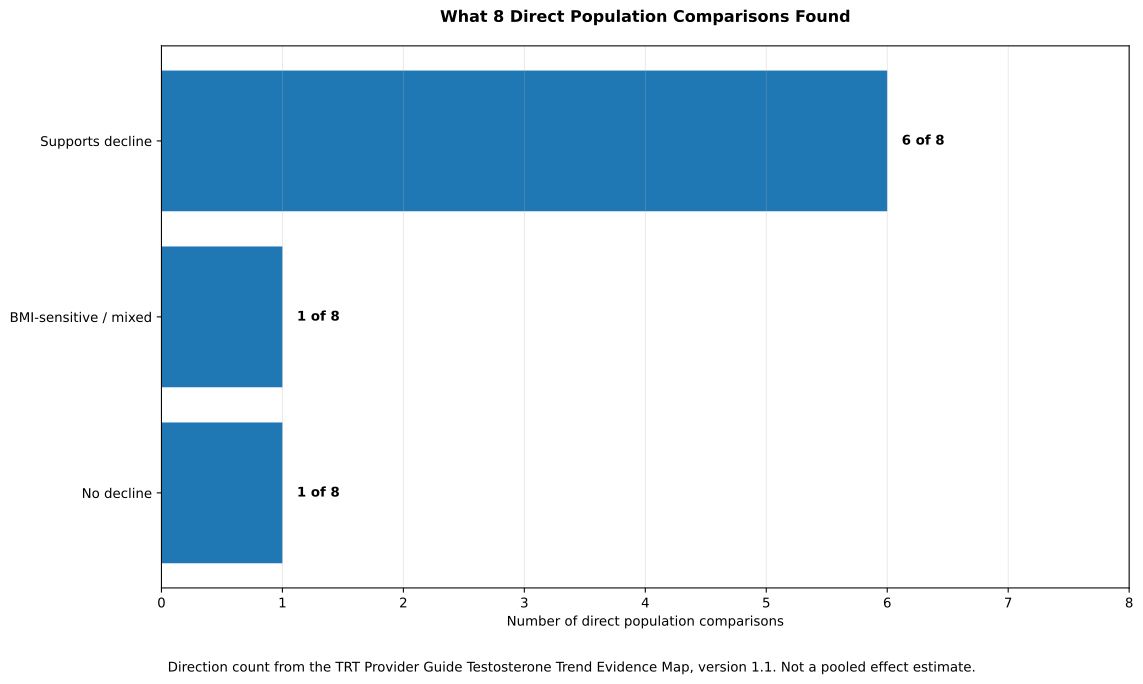
Download the 11-record evidence map as CSV or open the chart as an SVG. The CSV records the evidence layer, sample, date range, age handling, result, BMI handling, assay warning, direction code, and primary source for each record.
Verification and updates
Every record was rechecked on September 3, 2026. The most time-sensitive item is the Levy conference result. This page should be reviewed when a full paper appears, when a new direct trend study is published, or when the Endocrine Society or CDC changes the guidance used here.
Testosterone decline statistics: what did the eight direct studies find?
Most direct comparisons point down, but they do not all tell the same story. Six supported a decline, one became mixed after BMI and free testosterone were considered, and one found no decline in the U.S. general population. The table keeps the finding and the biggest caution side by side so neither gets lost.
TRT Provider Guide Testosterone Trend Evidence Map
| Study and setting | Years and sample | Main finding | Evidence-map code | Largest caution | Primary source |
|---|---|---|---|---|---|
| D1 — Travison et al. 2007 — Greater Boston, U.S. | 1987–1989, 1995–1997, and 2002–2004; 1,532 men and 2,769 observations | Age-matched total testosterone fell about 1.2% per calendar year. Measured changes in obesity, smoking, health, medicine use, and lifestyle did not explain the full trend. | Supports decline | Regional cohort, attrition, and an older assay era; not a universal U.S. rate | Original report |
| D2 — Andersson et al. 2007 — Denmark | Four surveys from 1982–1983 through 1999–2001; 5,350 male serum samples | Later groups had lower total testosterone, but the time effect was no longer significant after BMI adjustment. Free testosterone showed no age-independent decline. | BMI-sensitive / mixed | BMI changed the main total-testosterone result; free testosterone did not follow the same pattern | Original report |
| D3 — Nyante et al. 2012 — U.S. NHANES | 1988–1991 versus 1999–2004; 2,315 men with morning samples | Adjusted total testosterone changed by −0.03 ng/mL, equal to −3 ng/dL, with p=0.75. The authors found no evidence of a population decline. | No decline | Only two broad survey periods; the result does not settle later decades or every subgroup | Original report |
| D4 — Perheentupa et al. 2013 — Finland | Surveys in 1972, 1977, and 2002; 3,271 men ages 25–74 | Later birth groups had lower total and free testosterone after age matching. The differences remained after BMI adjustment. | Supports decline | Long storage and lab-comparability issues matter; the largest percentage is one age-band example | Original report |
| D5 — Trimpou et al. 2012 — Gothenburg, Sweden | 1995 versus 2008; 1,616 men and women overall. Hormones were measured in every fourth participant; the male hormone groups ages 35–64 included 151 men in 1995 and 61 men in 2008 | Men tested in 2008 had lower free testosterone. Total testosterone was lower in men ages 55–64 and stayed lower after correction for body weight. | Supports decline | Small male hormone subsample; total testosterone was not lower in every male age group | Original report |
| D6 — Chodick et al. 2020 — Israel | January 2006 through March 2019; 102,334 first testosterone tests in males ages 13–80 | Age-specific total testosterone fell in most age groups. At age 21, values fell from 19.68 nmol/L in 2006–2009 to 17.76 nmol/L in 2016–2019, or 9.8% by our calculation. | Supports decline | Only males sent for testing were included; the indication was unknown, and the trend model was not adjusted with person-level BMI | Original report |
| D7 — Laranja et al. 2020 — Brazil | 2010–2017; 2,874 measurements in a routine male health program | Total testosterone fell 10.68 ng/dL per year, reported as 1.6% of the sample median per year. Declines appeared in all three age bands. | Supports decline | Clinic-program sample, no BMI adjustment, and values outside the lab’s normal range were excluded | Original report |
| D8 — Lokeshwar et al. 2021 — young U.S. males in NHANES | Five cycles: 1999–2000, 2003–2004, 2011–2012, 2013–2014, and 2015–2016; 4,045 males ages 15–39 | Mean total testosterone fell from 605.39 to 451.22 ng/dL, or 25.5% by our calculation. The later-cycle decline remained after adjustment and was also seen in the normal-BMI group. | Supports decline | Three assay methods were used across cycles; no testosterone data were available for 2005–2010 | Original report |
Source: the eight original reports linked in each row. Direction labels, plain-language summaries, and calculations are by TRT Provider Guide. Last verified September 3, 2026. This is a curated evidence map, not an exhaustive systematic review or a pooled meta-analysis.
Why one strong study is kept outside the eight-study count
Mazur and colleagues followed 991 U.S. Air Force veterans across six examinations over 20 years. Men who lost weight or gained no more than 2% still had an average testosterone fall of 117 ng/dL, or 19%.
That is useful evidence against weight gain as the whole explanation. We still keep it outside the eight direct anchor comparisons. The same men grew older while calendar time passed, so the design is not as clean for the simple question, “Were men of the same age lower in later years?”
This choice is conservative on purpose. Counting Mazur would make the headline larger, but separating it makes the comparison set easier to defend.
How much have testosterone levels fallen?
There is no single honest worldwide percentage. The studies report different rates because they cover different men, ages, years, countries, hormone measures, and lab methods. The safest number is always the one tied to its exact population and dates.
| Number | Where it comes from | Status | Safe interpretation |
|---|---|---|---|
| −1.2% per calendar year | Travison, Greater Boston, 1987–2004 | Source-reported age-matched model estimate | A regional population estimate, not a rule for each man or country |
| 37.0% lower | Finnish men ages 60–69: 21.9 versus 13.8 nmol/L in two age-matched birth groups | Calculated from source-reported means | One age-band and cohort contrast; not Finland’s decline at every age and not a global rate |
| 19% lower over 20 years | Mazur, veterans who lost weight or gained no more than 2% | Source-reported | Same-men supporting evidence; aging and calendar time overlap |
| 9.8% lower at age 21 | Israeli testing data: 19.68 nmol/L in 2006–2009 versus 17.76 nmol/L in 2016–2019 | Calculated from source-reported values | An age-specific change in a referred testing population |
| −10.68 ng/dL per year | Brazilian male health program, 2010–2017 | Source-reported | An eight-year clinic-program trend; not adjusted for BMI |
| 25.5% lower | Young U.S. male NHANES mean: 605.39 versus 451.22 ng/dL | Calculated from source-reported means | A raw first-to-last comparison with a major three-assay warning |
| 20.4% lower in the normal-BMI group | Same young U.S. analysis: 664.79 versus 529.24 ng/dL | Calculated from source-reported means | Suggests BMI does not explain the whole result; assay changes still apply |
| No meaningful decline | Nyante U.S. NHANES comparison | Source-reported adjusted result | Adjusted total-testosterone change was −3 ng/dL with p=0.75 |
| −0.26 nmol/L per year, about −7.5 ng/dL per year | Levy 2026 pooled meta-trend | Source-reported slope; unit conversion by TRT Provider Guide | Preliminary conference result across included studies, not a personal annual loss |
Source: Travison, Perheentupa, Mazur, Chodick, Laranja, Lokeshwar, Nyante, and Levy.
We calculated a percentage only when the paper gave an earlier and later value but did not print the percentage:
Percent lower = (earlier value − later value) ÷ earlier value × 100
Every calculated value is marked as calculated. We did not average the percentages in Table 5. Doing so would mix unlike data and create a number that no study actually found.
This is the most important rule for quoting the research: keep the place, age group, dates, and method attached to the number. A large figure without those labels is easier to share, but much easier to misuse.
Is falling testosterone different from normal aging?
Yes—normal aging and a secular decline are separate questions. Aging asks what happens as one man gets older. A secular decline asks whether a man of a given age tends to test lower now than a man of the same age tested years earlier.
All 8 of 8 direct comparisons in our anchor table had to handle age through matching, age groups, statistical adjustment, or a closely matched repeated sample. A study that showed only that older men have lower testosterone did not qualify for the anchor count.
| Question | Simple example | Best study design | Main trap |
|---|---|---|---|
| Normal aging | Does one man’s testosterone change from age 40 to 60? | Follow the same man or age groups over time | Health and weight can change as he ages |
| Secular or calendar-time change | Is a 40-year-old tested in 2020 lower than a similar 40-year-old tested in 1990? | Age-matched or age-adjusted groups measured in different years | Lab methods and the people being tested can also change |
| Birth-cohort change | Are men born later lower when measured at the same age? | Same-age groups from different birth years | Calendar period and birth cohort can be hard to separate |
Source: TRT Provider Guide study-design framework applied to the eight direct reports in Table 4.
A personal age-related decline does not answer this page’s question. A personal aging pattern and a calendar-time population trend can happen together, but they are not interchangeable.
The distinction matters for headlines. Saying “testosterone is down each year” can sound as though every man loses the same amount because one more calendar year passes. That is not what a population secular-trend model means.
Is obesity the main reason testosterone is falling?
Obesity may explain part of the decline, but the direct evidence does not support it as the only explanation. In our eight-study audit, a decline remained after some form of BMI or body-weight analysis in four comparisons. One trend disappeared after BMI adjustment, one adjusted study found no decline, and two did not offer a clean person-level BMI test.
| BMI or weight result | Count | Studies | What it means |
|---|---|---|---|
| Decline remained after BMI or weight analysis | 4 of 8 — 50.0% | Travison, Perheentupa, Trimpou, Lokeshwar | Weight did not remove the full decline signal in these reports |
| Main total-testosterone trend lost significance after BMI adjustment | 1 of 8 — 12.5% | Andersson | BMI was enough to change the Danish conclusion for total testosterone |
| No decline in a multivariable model that included BMI and waist | 1 of 8 — 12.5% | Nyante | The adjusted U.S. comparison was null |
| No clean person-level BMI test of the trend | 2 of 8 — 25.0% | Chodick, Laranja | Chodick reported little change in group BMI but did not adjust the person-level trend; Laranja did not include BMI |
Source: TRT Provider Guide BMI-sensitivity audit of the eight original reports in Table 4. This is a method count, not an estimate of how much of the decline obesity causes.
The broader 2025 review also tried to address BMI. Its fully adjusted testosterone model could use BMI for 742 of 1,504 study groups, or 49.3%, because BMI was not available for every group. The downward time trend remained in that subset.
The Mazur veteran study adds another clue. Even men whose weight stayed about the same or fell had a 19% average testosterone drop over 20 years. That does not prove weight is unimportant. It shows that avoiding weight gain did not prevent the decline in that cohort.
There is no contradiction in saying both of these things:
- Higher body weight can be linked with lower testosterone.
- Body weight does not explain every reported time trend.
The studies do not tell us one clean percentage for obesity’s share. Any claim such as “obesity explains 70% of the decline” would need its own direct source. We did not find one that could support a universal number.
Why might testosterone levels be declining?
No study has proved one main cause of the population trend. BMI or body weight was the explanation tested most often. Six of eight direct studies used a person-level BMI or weight adjustment or correction, Chodick reported group BMI patterns without a person-level trend adjustment, and Laranja did not include BMI. The results were mixed.
Other ideas may be reasonable to study, yet the eight trend datasets do not measure how much each one contributes.
| Possible explanation | What the evidence on this page shows | What it does not prove |
|---|---|---|
| Body weight and metabolic health | BMI changed one study’s result, while four decline signals remained after some weight or BMI analysis | It does not give one causal share for all countries or decades |
| Health, medicines, smoking, alcohol, and activity | Several studies adjusted for some of these factors and still found a decline | Adjustment cannot remove every unmeasured difference, and the studies used different variables |
| Who gets tested | Two of eight direct datasets came from testing or health-program populations rather than broad random samples | We cannot tell how much changing referral patterns shifted their averages |
| Laboratory methods | One young-U.S. dataset crossed three assay eras, and the largest review’s mass-spectrometry subgroup was null | Method change cannot automatically explain every decline, especially where one lab or one method was used |
| Environmental or lifestyle exposures not measured in the datasets | The newest abstract and reviews call for more study of possible causes | The direct evidence map cannot name one exposure as the proven driver or give it a percentage |
| A change in hormone signaling | The 2025 review found that luteinizing hormone, or LH, also moved down over study years | A parallel LH trend is a clue, not proof of why the change happened |
Source: TRT Provider Guide cause-evidence framework based on the direct studies, Santi et al. 2025, and Levy et al. 2026.
The LH finding is worth explaining. Luteinizing hormone is a signal from the pituitary gland that helps tell the testes to make testosterone. In the 2025 review, LH data covered 492 study groups and 114,961 men. Follicle-stimulating hormone, or FSH, data covered 422 groups and 88,064 men. LH declined over time, while FSH did not show the same trend.
The authors described the joint testosterone-and-LH result as a possible change in the body’s hormone-control setting. That is a hypothesis. It is not a proven mechanism. The LH analysis also could not be fully adjusted for BMI because only 52 study groups had both LH and BMI data.
The key rule is simple: a cause list is not a cause study. Sleep, stress, diet, medicines, illness, activity, heat, or chemical exposure may deserve research. The trend papers on this page do not tell us which one is “the reason.”
Could changing lab tests explain part of the decline?
Yes—changing test methods could create, hide, or magnify part of an apparent trend. That does not prove the whole decline is a lab artifact. Any long time-series should show how samples were handled, which assay was used, and whether results stayed comparable.
| Evidence | Number or result | Why it matters |
|---|---|---|
| Young-U.S. NHANES study | 3 assay methods across the included cycles | The raw 25.5% first-to-last change crosses method changes, so it is not a clean biological percentage |
| Earlier U.S. NHANES comparison | Both survey sets were measured with competitive electrochemiluminescence immunoassays, and the authors checked laboratory comparability; adjusted result −3 ng/dL, p=0.75 | A two-period comparison with a method-comparability check found no decline, although it covered an earlier and shorter window |
| 2025 systematic review | Mass-spectrometry subgroup: no significant trend; only 5 of 117 papers, covering 8 study groups, were from before 2000 | The more specific-method subgroup was null, but it had little early-period evidence and may not show a long trend well |
Source: Lokeshwar et al. 2021, Nyante et al. 2012, and Santi et al. 2025.
The Brazilian study is another useful counterpoint. It used morning fasting samples and tandem mass spectrometry throughout an eight-year window, yet it still reported a decline of 10.68 ng/dL per year. Its limits are different: it was a smaller health-program sample, had no BMI adjustment, excluded results outside the lab’s normal range, and covered only 2010–2017.
The U.S. Centers for Disease Control and Prevention runs a hormone standardization program because testosterone results need to be accurate and comparable. The CDC uses high-performance liquid chromatography with tandem mass spectrometry as a reference method and checks participating tests against performance goals.
So the honest conclusion is not “old tests made the decline.” It is: assay history is a major source of uncertainty, and studies that control it well deserve more weight.
Did testosterone levels fall 54%?
A 54% fall is not safe to present as a settled, reproducible finding from the available source. The number appeared in July 2026 news coverage, but it is not printed in the official conference abstract. The abstract also does not give one pooled starting testosterone value or modeled pair of endpoints needed to verify that percentage.
| Item | News coverage | Official 2026 abstract | Audit result |
|---|---|---|---|
| Number of studies | 6 long-running or longitudinal studies | 12 included studies and 40 data points | The counts do not match |
| Participants | 118,593 | 102,334 | Difference: 16,259 participants |
| Time period | 1972–2019 | 1972–2019 | Matches |
| Total-testosterone result | 54% lower | −0.26 nmol/L per year | The abstract gives a slope, not the 54% figure |
| Pooled starting value | Not clearly shown in the article | Not provided | The percentage cannot be independently rebuilt from the abstract alone |
| Evidence status | News report | Conference abstract | A full paper was not located as of September 3, 2026 |
Source: The Guardian’s July 7, 2026 report and the official Human Reproduction conference abstract.
We also ran a simple arithmetic check. This is our reconstruction test, not a result reported by the authors:
- The span from 1972 to 2019 is 47 years.
- A straight-line change of 0.26 nmol/L per year × 47 years equals 12.22 nmol/L.
- For a 12.22 nmol/L fall to equal 54%, the starting value would need to be about 22.63 nmol/L.
- The implied ending value would be about 10.41 nmol/L.
Those starting and ending values are not printed in the abstract. The abstract also reports different slopes before and after 2000, so a straight-line reconstruction cannot replace the authors’ model.
The right conclusion is narrow:
“A 2026 conference abstract found a strong decline in total and free testosterone, but the widely reported 54% figure cannot be reproduced from the published abstract alone because it does not provide the pooled starting value or modeled endpoints.”
This does not prove 54% is false. It means the public source now available does not show enough work to verify it.
Why does this question matter now?
The evidence became stronger in 2025 and 2026, but the public claim became more exact than the published data. A full review of 1,064,891 men supports a downward trend. The newest annual rate, however, is still an abstract, while a 54% figure had already appeared in news coverage.
| Evidence stage | Current item | What is ready to report | What still needs care |
|---|---|---|---|
| Full peer-reviewed synthesis | Santi et al. 2025 | Broad direction, sample scale, adjustment results, and method-subgroup findings | It uses study-group averages; designs and assays differ, and BMI was available for about half of groups |
| Published conference abstract | Levy et al. 2026 | Reported slopes, included-study count, data years, and stated limits | Full study list, model detail, baseline values, and complete sensitivity results |
| Secondary news claim | 54% fall and 118,593 participants | That these figures were reported in news coverage | They conflict with or go beyond the numbers printed in the abstract |
Source: Santi et al. 2025, Levy et al. 2026, and the July 2026 news report.
This matters for science reporting. A writer can fairly say that the balance of current evidence supports a population decline. A writer should not turn that conclusion into one worldwide percentage unless the source shows how the percentage was calculated.
It also matters for personal health. A population average can raise a research question without proving that one person is ill or needs treatment. The Endocrine Society made that point again in a July 2026 statement: symptoms alone are not a diagnosis, low results must be measured accurately and consistently, and routine population screening of men without symptoms is not supported.
What does this mean for one person’s blood test?
A population trend cannot tell one person whether he has low testosterone. All 8 of 8 anchor studies describe groups or populations; 0 of 8 can diagnose an individual. A personal diagnosis needs symptoms or signs, accurate testing, and clinical context.
The Endocrine Society recommends diagnosing hypogonadism only when a man has symptoms or signs that fit testosterone deficiency and clearly and consistently low testosterone. It recommends accurate assays, sound reference ranges, and confirmation with at least two early-morning fasting total-testosterone measurements.
A result can be shaped by test time, medicines, body weight, and the lab method. A clinician may also need to look for a cause rather than treating the number alone.
This page is for education and research. It does not diagnose low testosterone or tell anyone to start, stop, or change treatment. Questions about a personal result belong with a qualified health professional who can review symptoms, repeat testing when needed, and consider the full medical picture.
Clinical source: Endocrine Society statement on testosterone replacement therapy, July 16, 2026. Laboratory source: CDC Steroid Hormones Standardization Programs.
What are the limits of this evidence?
The direction is more certain than the size, cause, or worldwide reach of the decline. The eight direct comparisons come from only six countries, use different lab methods, and include both broad population samples and selected testing groups. A strong answer must keep those limits beside the headline.
| Limit | Evidence-map count or detail | Why it matters |
|---|---|---|
| Limited geography | 8 studies from 6 countries; 3 of 8 are from the United States | Six countries are not the world; no direct anchor in this version came from Africa or Oceania |
| Selected clinical or health-program samples | 2 of 8: Chodick and Laranja | Who was tested may have changed over time |
| Different hormone outcomes | Studies used total testosterone, free testosterone, SHBG, or a mix | A fall in total testosterone does not always mean the same fall in free testosterone |
| Different assay histories | At least one major dataset crossed 3 assay methods; several older studies have storage or comparability concerns | A method shift can look like a biological shift or hide one |
| Uneven BMI data | Clean person-level weight or BMI handling was not available in all eight direct studies or all 1,504 review groups | The field cannot give one firm causal share for obesity |
| Incomplete newest report | The 2026 pooled result is a conference abstract, not a full paper | Key tables and model details are not yet public |
| No valid homemade pooled percentage | Study populations, years, units, and models differ | Averaging their percentages would create false precision |
Source: TRT Provider Guide evidence-map audit; Santi et al. 2025; Levy et al. 2026.
This evidence map is curated, not exhaustive. A full systematic review would also document its database search, duplicate screening, study-selection flow, risk-of-bias method, and exclusion rules. The 2025 paper and 2026 abstract did broader literature syntheses. This page does a different job by making the direct evidence easy to inspect.
The count also treats every direct comparison as one directional record. It does not give a 102,334-person study more voting power than a smaller study. That is why 6 of 8 should never be described as a pooled probability, effect size, or proof that 75% of men are affected.
Finally, a time trend is not a cause. Even a well-measured fall can come from several changes at once. The evidence is strong enough to take the question seriously and limited enough to reject a one-line universal answer.
How to cite this page
This block gives neutral publication details for the article and its original evidence map. The current dataset is version 1.1 and was last verified September 3, 2026. The formats below are provided so the source and version can be identified accurately.
Article citation
TRT Provider Guide. “Are Testosterone Levels Declining? 2026 Evidence Map.” TRT Provider Guide Research. Version 1.1. Last verified September 3, 2026. https://trtproviderguide.com/research/are-testosterone-levels-declining/
Dataset citation
TRT Provider Guide. TRT Provider Guide Testosterone Trend Evidence Map. Version 1.1. September 3, 2026. https://trtproviderguide.com/research/are-testosterone-levels-declining/#trt-provider-guide-testosterone-trend-evidence-map
Suggested quotation with full qualifier
“Across eight direct population comparisons from six countries, six support a decline in total or free testosterone, one is BMI-sensitive, and one found no decline. This is a direction count from a curated evidence map, not a pooled effect estimate.”
Frequently asked questions
These answers cover the most common follow-up questions without changing the limits of the evidence. The core result stays the same: a population decline is likely in many settings, but one global rate or cause is not settled.
Are men’s testosterone levels lower than 50 years ago?
In several studied populations, men of the same age had lower testosterone in later years. The direct evidence map includes data reaching back to 1972, and six of eight comparisons support a decline. It does not prove the same 50-year change in every country or age group.
How fast are testosterone levels declining?
There is no one rate that fits all men or countries. The newest pooled abstract reported total testosterone falling 0.26 nmol/L per year, about 7.5 ng/dL per year, but that result is preliminary and should not be treated as a personal annual loss.
Are young men’s testosterone levels declining?
Some evidence says yes. A U.S. study of 4,045 males ages 15–39 found a 25.5% raw first-to-last decline, and an Israeli dataset showed a 9.8% drop at age 21. The U.S. study crossed three assay methods, while the Israeli study included only people sent for testing, so neither number is a clean worldwide estimate.
Is the decline just normal aging?
No. Normal aging follows a person as he gets older. A secular decline compares similar-age men in different calendar years, and all eight anchor studies had to handle age before entering the evidence map.
Is obesity the main cause?
Obesity may explain part of the pattern, but not all of it. Four of eight direct comparisons still had a decline after some BMI or weight analysis, while one Danish trend disappeared after BMI adjustment. The studies cannot assign one universal percentage to obesity’s role.
Did testosterone levels fall 54%?
The official 2026 conference abstract reports a strong decline, but it does not print a 54% result or the pooled starting value needed to reproduce one. News coverage and the abstract also give different study and participant counts. The 54% figure remains unverified from the published abstract alone.
What is a secular decline in testosterone?
A secular decline is a drop across calendar time or birth groups after age is taken into account. In plain terms, it asks whether a man of a given age tends to test lower now than a similar-age man tested years earlier.
Can one testosterone test show that I have low testosterone?
Not by itself. The Endocrine Society recommends symptoms or signs plus clearly and consistently low testosterone measured with accurate tests, using at least two early-morning fasting total-testosterone measurements. A qualified clinician should interpret a personal result in context.
Related research
Testosterone levels by age: a source-based reference
TRT Provider Guide research library
What sources support this page?
The references below are the original studies, current syntheses, and official clinical or laboratory sources used in the article. A news report appears only because it is the source of the public 54% claim being audited; it is not used as proof of a testosterone trend.
- Travison TG, Araujo AB, O’Donnell AB, Kupelian V, McKinlay JB. “A Population-Level Decline in Serum Testosterone Levels in American Men.” The Journal of Clinical Endocrinology & Metabolism. 2007;92(1):196–202.
- Andersson AM, Jensen TK, Juul A, Petersen JH, Jørgensen T, Skakkebæk NE. “Secular Decline in Male Testosterone and Sex Hormone Binding Globulin Serum Levels in Danish Population Surveys.” The Journal of Clinical Endocrinology & Metabolism. 2007;92(12):4696–4705.
- Nyante SJ, Graubard BI, Li Y, McQuillan GM, Platz EA, Rohrmann S, Bradwin G, McGlynn KA. “Trends in Sex Hormone Concentrations in US Males: 1988–1991 to 1999–2004.” International Journal of Andrology. 2012;35(3):456–466.
- Perheentupa A, Mäkinen J, Laatikainen T, Vierula M, Skakkebæk NE, Andersson AM, Toppari J. “A Cohort Effect on Serum Testosterone Levels in Finnish Men.” European Journal of Endocrinology. 2013;168(2):227–233.
- Trimpou P, Lindahl A, Lindstedt G, et al. “Secular Trends in Sex Hormones and Fractures in Men and Women.” European Journal of Endocrinology. 2012;166(5):887–895.
- Chodick G, Epstein S, Shalev V. “Secular Trends in Testosterone—Findings from a Large State-Mandate Care Provider.” Reproductive Biology and Endocrinology. 2020;18:19.
- Laranja WW, Riccetto E, Amaro MP, Reis LO. “Age-Independent Secular Testosterone Populational Trends Among Brazilian Males.” International Urology and Nephrology. 2020;52(7):1199–1202.
- Lokeshwar SD, Patel P, Fantus RJ, et al. “Decline in Serum Testosterone Levels Among Adolescent and Young Adult Men in the USA.” European Urology Focus. 2021;7(4):886–889.
- Mazur A, Westerman R, Werdecker A, Mueller U. “Is Rising Obesity Causing a Secular (Age-Independent) Decline in Testosterone Among American Men?.” PLOS ONE. 2013;8(10):e76178.
- Santi D, et al. “Temporal Trends in Serum Testosterone and Luteinizing Hormone Levels Indicate an Ongoing Resetting of Hypothalamic-Pituitary-Gonadal Function in Healthy Men: A Systematic Review.” Journal of Endocrinological Investigation. 2025;48:2721–2734.
- Levy M, et al. “L26/O-204 Temporal Trends in Total and Free Testosterone (1972–2019): A Systematic Review and Meta-Trend Analysis.” Human Reproduction. 2026;41(Supplement 1). Conference abstract.
- Endocrine Society. “Statement on Testosterone Replacement Therapy.” July 16, 2026.
- U.S. Centers for Disease Control and Prevention. “Steroid Hormones Standardization Programs.” Accessed September 3, 2026.
- Endocrine Society. “Glossary.” Accessed September 3, 2026.
- The Guardian. “Men’s Average Testosterone Levels Have Halved in Last 50 Years, Say Scientists.” July 7, 2026. Secondary source used only to audit the public 54% claim.