Testosterone Replacement Therapy Market Size: 2026 Data Audit
By TRT Provider Guide
Last verified and updated: September 3, 2026
Editorial status: Evidence-cited educational research; not medically reviewed. See our Research and Data Methodology and Medical Review Policy.
Dataset: Testosterone Replacement Therapy (TRT) Market-Estimate Integrity Audit, version 1.2.0
The global testosterone replacement therapy market size is about $2.21 billion in 2026. We reached that figure by taking the median of six estimates that passed six public checks in our audit of a fixed set of 15 direct public estimate pages. The same usable set gives a 2025 median of $2.13 billion, and all six normalized 2025 estimates fall between $1.98 billion and $2.17 billion.
Core finding: A 15-page audit found a 2026 global testosterone replacement therapy market benchmark of $2.21 billion. Six estimates passed all six checks. All six usable 2025 estimates fell between $1.98 billion and $2.17 billion. Removing the one wider-scope source or putting all nine failed pages back gives the same 2026 sensitivity result: $2.23 billion, just $13 million above the main median.
Source: TRT Provider Guide, TRT Market-Estimate Integrity Audit, 2026 Edition, version 1.2.0. Verified September 3, 2026.
The surprise is not just the number. It is how hard the number is to move. The main, strict, and all-page 2026 medians stay within 0.6% of one another.
Important limit: This is a reproducible middle of published estimates. It is not an audited count of every testosterone sale in the world.
What is the testosterone replacement therapy market size at a glance?
The best plain answer is $2.21 billion for 2026. The 2025 benchmark is $2.13 billion, while the same method points to about $2.59 billion in 2030 if the published growth paths hold.
| Question | Answer | Basis |
|---|---|---|
| Global TRT market size, 2025 | $2.13B | Median of six usable estimates |
| Global TRT market size, 2026 | $2.21B | Median of the same six estimates put on 2026 |
| Strict product-focused market size, 2026 | $2.23B | Median after removing one wider goods-and-services row |
| Global TRT market size, 2030 | $2.59B | Median of the same six published forecast paths |
| Middle half of usable 2026 estimates | $2.15B–$2.24B | 25th to 75th percentile |
| Typical stated growth rate | 4.1% a year | Median reported CAGR |
| Pages that passed all six checks | 6 of 15 | Fixed direct-page audit set |
| Usable 2025 estimates in the tight cluster | 6 of 6 | $1.98B–$2.17B |
Source: TRT Provider Guide Market-Estimate Integrity Audit, version 1.2.0. Values are in U.S. dollars. Verified September 3, 2026.
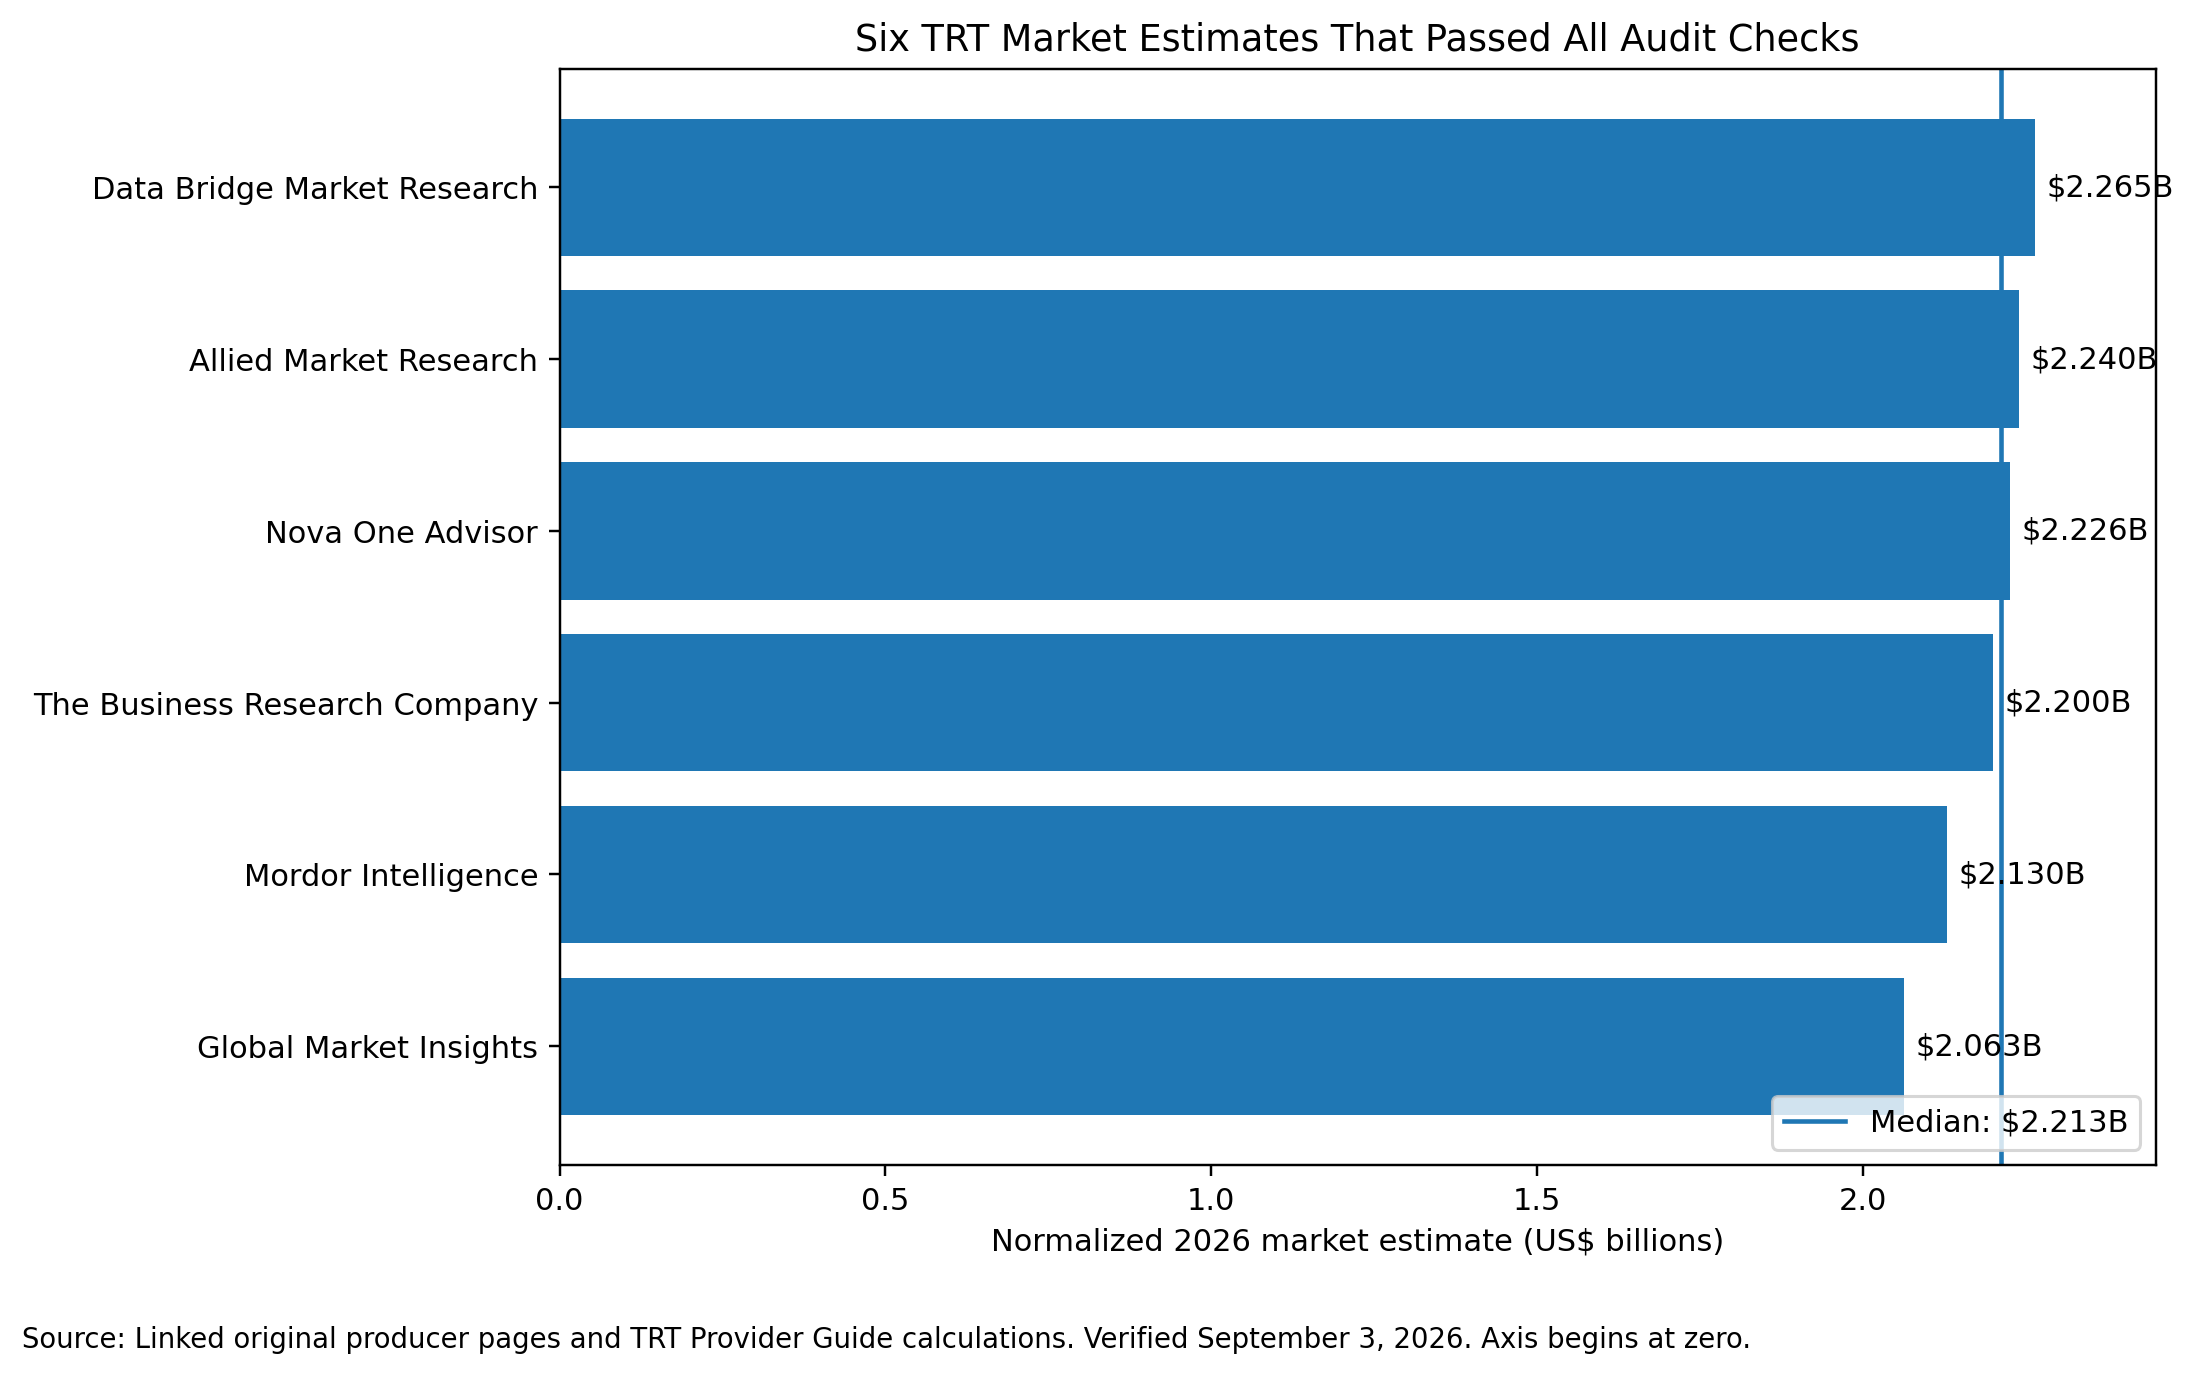
Source: Linked original producer pages and TRT Provider Guide calculations. Verified September 3, 2026.
Download the audit data: TRT Market-Estimate Integrity Audit, version 1.2.0 (JSON)
A median is the middle number after all values are placed in order. TRT is short for testosterone replacement therapy. CAGR, or compound annual growth rate, is the smooth yearly rate needed to move from a starting value to an ending value. Real markets do not grow in a perfectly smooth line, so CAGR is a summary, not a year-by-year sales record.
Suggested citation: TRT Provider Guide. “Testosterone Replacement Therapy Market Size: 2026 Data Audit.” TRT Provider Guide. Last updated September 3, 2026. https://trtproviderguide.com/research/testosterone-replacement-therapy-market-size/
What does this market-size benchmark show—and what does it not show?
This benchmark shows the center and spread of public TRT market estimates after they are placed on the same years. It also shows how much the result changes when wider scope and public-page problems are removed.
| It shows | It does not show |
|---|---|
| The median of six usable public estimates | An official worldwide sales census |
| The range and middle half of those estimates | A public sale-by-sale record |
| The effect of using a strict product-only scope | The number of patients, prescriptions, doses, or visits |
| Which public pages had visible conflicts on the check date | Whether a publisher’s private paid report has the same problem |
| A common-year 2025, 2026, and 2030 comparison | Proof that any forecast will come true |
| Cross-source product and regional patterns | A clean estimate of online clinic fees or membership revenue |
Source: TRT Provider Guide audit framework, version 1.2.0; verified September 3, 2026.
In this study, market size means estimated annual revenue in U.S. dollars. Most usable pages focus on testosterone products such as injections, gels, creams, patches, oral products, implants, or buccal products. The exact price point in the supply chain is not always public. One model may use a manufacturer value, while another may use a channel or end-market value.
The original report producer is the direct source for its own estimate. That does not make any one estimate an official measure of actual worldwide sales. We therefore report the median, the spread, the scope, and the limits together.
How did we calculate the 2026 TRT market-size benchmark?
We started with a fixed set of 15 direct public estimate pages, checked each page using the same six rules, and kept the six pages that passed. We then moved each usable estimate to common years and calculated an unweighted median.
How did we build the source set?
We looked for original report-producer pages or issuer-authored releases that published an absolute global testosterone replacement therapy market value. Before the 15-page audit, we screened out reseller copies, duplicate press releases, regional-only pages, narrow single-product studies, broad hormone replacement therapy reports, and pages that did not reveal enough data to calculate a global value.
We listed the 15 direct pages before running the final calculation. We did not add or remove pages because their values were high, low, or close to the median. This lowers the risk of choosing sources only because they produce a preferred result.
Version 1.2.0 keeps the same fixed 15-page set. It moves four rows from the usable table to the excluded table after a second pass applied check 5 consistently. The rounded 2025, 2026, and 2030 headline values did not change.
This is still a public-web sample, not a complete list of every private market model.
What were the six public checks?
A page entered the main benchmark only if it passed all six checks below.
| Check | Rule | Why it matters |
|---|---|---|
| 1 | The page is from the original report producer or an issuer-authored release | Avoids reseller copies and unattributed repeats |
| 2 | Global scope is clear | Prevents U.S., regional, or single-country figures from entering the global total |
| 3 | Public numbers are sufficient | A base value plus CAGR, two endpoints, or a direct target-year value is needed |
| 4 | The printed arithmetic is coherent | The CAGR implied by the endpoints must be within 0.25 percentage points of the stated rate, allowing for rounding |
| 5 | The public page has no material internal conflict or unrelated topic text | A reader must be able to tell which values and subject belong to the report |
| 6 | The page is not an obvious reseller copy or duplicate of another row | Prevents one published estimate from being counted twice |
Source: TRT Provider Guide Market-Estimate Integrity Audit methodology, version 1.2.0.
Six pages passed all six checks. Nine direct pages failed check 5 because we could not reconcile a visible conflict or unrelated text on the public page. No page was excluded because its estimate was high or low.
How did we put different years on the same line?
When a source printed the target year, we used the printed value. When it did not, we used the nearest earlier public value and the source’s own stated CAGR:
Target-year value = nearest earlier published value × (1 + stated CAGR)^(number of years)
For example, Global Market Insights reported a $1.90 billion market in 2024 and a 4.2% CAGR. Its normalized 2026 value is:
$1.90B × 1.042² = $2.063B
We kept more decimal places for the calculations than we show in the headline. The headline is rounded to the nearest $10 million.
Why did we use the median instead of the average?
The median limits the pull of one unusually high or low estimate. The six-source 2025 average is about $2.10 billion, while the median is $2.125 billion. When all 15 direct pages are restored, the 2025 average rises to about $2.17 billion, while the median is $2.130 billion.
We did not weight publishers by brand size, report price, or claimed method quality. The public pages do not provide one common measure that would support a fair weighting system.
What do “broad” and “strict” mean?
The broad usable set contains all six pages that passed the six checks. The strict set contains five of those pages and removes one public definition that includes testing and related services.
The broad set is the main benchmark because it shows the center of the current usable public estimate field. The strict set is the sensitivity check because it is closer to a product-only TRT market.
How did we calculate the middle-half range?
The middle-half range runs from the 25th percentile to the 75th percentile. In simple terms, it shows the center half of the ordered values.
We used inclusive linear interpolation, the same approach used by Excel’s PERCENTILE.INC function. This range is not a statistical confidence interval. It only describes the spread of the audited estimates.
Which testosterone replacement therapy market-size estimates passed the audit?
Six direct public pages passed all six checks. Their normalized 2026 values run from $2.063 billion to $2.265 billion. All six normalized 2025 values sit in a tight range from $1.980 billion to $2.165 billion.
| Original source page | Public values shown by source | CAGR used | 2025 normalized | 2026 normalized | 2030 normalized | Scope in this audit |
|---|---|---|---|---|---|---|
| Global Market Insights | $1.90B in 2024; $2.90B in 2034 | 4.20% | $1.980B | $2.063B | $2.432B | Strict product-focused |
| Mordor Intelligence | $2.05B in 2025; $2.13B in 2026; $2.57B in 2031 | 3.88% | $2.050B | $2.130B | $2.480B | Strict product-focused |
| Nova One Advisor | $2.06B in 2024; $2.14B in 2025; $3.04B in 2034 | 4.00% | $2.140B | $2.226B | $2.604B | Strict product-focused |
| Data Bridge Market Research | $2.07B in 2024; $2.48B in 2028; $2.97B in 2032 | 4.60% | $2.165B | $2.265B | $2.713B | Strict product-focused; visible page date predates its 2024 base year |
| Allied Market Research | $1.90B in 2022; $2.90B in 2032 | 4.20% | $2.150B | $2.240B | $2.641B | Strict product-focused |
| The Business Research Company | $2.11B in 2025; $2.20B in 2026; $2.57B in 2030 | 3.90% | $2.110B | $2.200B | $2.570B | Broader goods and services; page also rounds a longer forecast description to 4.0% |
Source: Linked original producer pages and TRT Provider Guide calculations. Direct target-year values were used when printed; other values were normalized with the stated CAGR. Verified September 3, 2026.
Five of the six usable pages use 2024 or 2025 as the base year. Allied Market Research uses 2022. The age of the starting point is one reason the normalized table is more useful than comparing the public headlines as written.
The source pages are primary sources for the estimates they publish. Their full paid models, private interviews, price assumptions, and country-level inputs are not public, so the estimates themselves cannot be rebuilt from raw sales data.
The Business Research Company page shows 3.9% for the 2026–2030 forecast in its report-attribute table and rounds a longer forecast description to 4.0%. We used 3.9% only for missing annual points; its printed 2025, 2026, and 2030 values were used directly.
Allied Market Research uses 2022 as its base and full-study start, while one FAQ line calls 2023 the start of the forecast period. We kept the row because its printed $1.90 billion 2022 base, $2.90 billion 2032 endpoint, and 4.2% CAGR agree within the stated rounding rule. No normalized headline year depends on treating 2023 as a new value.
Which TRT market estimates did we leave out, and why?
Nine direct public pages did not enter the benchmark because each had a material conflict or unrelated content that a reader could see on the page. An exclusion means only that the public page did not pass this audit on September 3, 2026. It is not a finding that the publisher’s private paid report is wrong.
| Source page | Public figures displayed | CAGR used in the all-page test | Public-page issue found on September 3, 2026 | Audit decision |
|---|---|---|---|---|
| Transparency Market Research | $2.00B in 2025; $3.20B in 2036 | 4.30% | The TRT page contains an unrelated heading about digital and cyber forensics capabilities | Excluded until the unrelated subject text is fixed |
| Spherical Insights & Consulting | $1.98B in 2023; $2.93B in 2033 | 4.00% | The page says TRT relies on reducing testosterone production and later calls the subject the global keratin products market | Excluded until the subject statements are reconciled |
| IMARC Group | $2.10B in 2025; $2.80B in 2034 | 3.14% | Its TRT “Recent Developments” section lists cetuximab for head and neck cancer and phenobarbital for neonatal seizures | Excluded until unrelated developments are removed or explained |
| Strategic Market Research | $2.94B in 2024; $4.36B in 2030 | 6.70% | The page gives North America/USA a 36% share in one section and about 38.5% in another | Excluded until one regional share is clear |
| 360iResearch | $2.13B in 2025; $2.23B in 2026; $2.94B in 2032 | 4.69% | The same page says its methodology excludes market sizing, market-share calculation, and forecasting | Excluded until the method and figures can be reconciled |
| SkyQuest Technology | $1.78B in 2025; $3.51B in 2033 | 8.90% | Another section on the same page labels the global market size as $1.50B without a matching year or reconciliation | Excluded until one current global value is clear |
| Market Data Forecast | $2.41B in 2025; $2.54B in 2026; $3.81B in 2034 | 5.22% | The summary also discusses remote cardiac care, cardiovascular disease, AI diagnostics, wearable cardiac monitors, and IT services | Excluded because unrelated topic text makes the public summary unreliable for this audit |
| DataM Intelligence | $2.05B in 2025; $2.92B in 2035 | 3.60% | The headline and summary use a 2026–2035 path, while the scope table says data through 2033 and a 2025–2033 forecast period | Excluded until the forecast window is consistent |
| Reports and Data | $2.15B in 2025; $2.27B in 2026; $4.15B in 2035 | 6.80% | The main page says $4.15B in 2035, while its FAQ says $4.50B in 2034 | Excluded until the forecast endpoint is consistent |
Source: Linked public pages. The CAGR column shows the rate used only for the all-15 sensitivity test. Exclusion reasons describe the pages as viewed on September 3, 2026.
All nine exclusions failed the same broad rule: the public page had a material internal conflict or unrelated content. They were not excluded for being outliers. Some sit close to the final median.
This matters because it separates a quality rule from a result-driven rule. A source should not enter merely because its number “looks right,” and it should not be removed merely because its number looks unusual.
Why do TRT market-size estimates disagree?
The main reason is scope. Some reports count prescription products, while one usable report counts related tests and services. Base years, prices, currencies, channels, and forecast models can add more differences.
What did each usable scope include?
Five usable pages were product-focused. The sixth passed the public-page checks but used wider boundaries, so we kept it in the broad benchmark and removed it in the strict test.
| Scope class | Number of usable pages | What the public pages appear to count | Treatment in this study |
|---|---|---|---|
| Strict product-focused | 5 | TRT products grouped by form, ingredient, channel, end user, or region | Included in broad and strict medians |
| Broader goods and services | 1 | Products plus testing, semen analysis, pituitary imaging, genetic studies, biopsy, and related goods or services | Included in broad median; removed from strict median |
Source: Public scope language on the six linked usable pages; TRT Provider Guide classification, verified September 3, 2026.
Mordor Intelligence gives one of the clearest strict definitions. It says its market covers prescription TRT products sold through formal health channels and excludes non-prescription testosterone boosters, dietary supplements, and compounded testosterone dispensed without market authorization.
The Business Research Company uses a wider value definition. Its page says the market includes revenue from hormone testing, semen analysis, pituitary imaging, genetic studies, testicular biopsy, and related goods or services.
One excluded page, Strategic Market Research, uses a wider list of applications. Its value appears only in the all-15 sensitivity test, not in the main or strict benchmark.
The source pages also do not use one clear rule for online-clinic membership fees, lab charges, or care-management fees. The $2.21 billion benchmark should therefore not be called the size of the online TRT clinic market.
How much does scope change the answer?
Less than the individual headlines suggest. The median remains close under three different tests.
| Test | Sources | 2025 median | Change from main | 2026 median | Change from main | 2030 median | Change from main |
|---|---|---|---|---|---|---|---|
| Main broad usable set | 6 | $2.125B | — | $2.213B | — | $2.587B | — |
| Strict product-focused set | 5 | $2.140B | +$15M | $2.226B | +$13M | $2.604B | +$17M |
| All 15 direct pages restored | 15 | $2.130B | +$5M | $2.226B | +$13M | $2.606B | +$19M |
Source: TRT Provider Guide calculations from the fixed 15-page audit set, version 1.2.0.
For 2026, both sensitivity tests land at $2.226 billion, about 0.58% above the main median. Every median in Table 7 stays within 0.8% of the main result for the same year.
That stability is the strongest reason to use about $2.21 billion as the 2026 public-source benchmark. It is still an estimate, but it does not depend on one publisher or one fragile inclusion choice.
What other choices can change a market estimate?
A report can value the same medicine at a manufacturer price, a distributor value, a pharmacy value, or an end-market value. It can also use different exchange rates, rebate assumptions, treated-patient counts, dosing patterns, and channel markups.
Those details are mostly inside paid models. The public pages rarely show enough information to reconcile every dollar. This study can compare the outputs and visible definitions; it cannot fully audit the hidden inputs.
How fast is the testosterone replacement therapy market growing?
The median stated growth rate among the six usable pages is 4.1% a year. If their published paths hold, the broad median rises from $2.125 billion in 2025 to $2.587 billion in 2030, an increase of about $462 million, or 21.7%.
| Year | Broad six-source median | Strict five-source median | Middle half of broad estimates |
|---|---|---|---|
| 2025 | $2.125B | $2.140B | $2.065B–$2.147B |
| 2026 | $2.213B | $2.226B | $2.148B–$2.236B |
| 2027 | $2.300B | $2.315B | $2.231B–$2.329B |
| 2028 | $2.391B | $2.407B | $2.318B–$2.426B |
| 2029 | $2.486B | $2.503B | $2.408B–$2.526B |
| 2030 | $2.587B | $2.604B | $2.503B–$2.631B |
Source: TRT Provider Guide calculations from the six usable published forecast paths. Direct values were used when available; other years were calculated from the nearest earlier public value and the source’s stated CAGR.
The increase from the 2025 broad median to the 2030 broad median works out to an implied smooth rate of about 4.0% a year. That is close to the 4.1% median of the source-reported CAGRs.
This annual line is not a new sales forecast built from patients, prices, or prescriptions. It is a common-year summary of forecasts already published by the source pages.
Which TRT product type has the largest market share?
Injections are the most consistent leading product class in the usable sources. All five usable product-focused pages identify injections or parenteral products as the largest or leading form, although only three publish a usable numeric share.
| Source | Source year | Public finding | Comparable numeric share |
|---|---|---|---|
| Global Market Insights | 2024 | Injectables generated $1.10B of a $1.90B total | 57.9%, calculated |
| Mordor Intelligence | 2025 | Injectables were the largest product type | 54.7% |
| Nova One Advisor | 2024 | The injectable segment dominated | Not stated publicly |
| Data Bridge Market Research | 2024 | Parenteral products led the product-type segment | 44.1% |
| Allied Market Research | 2022 | Injectables dominated product revenue | Not stated publicly |
Source: Linked public source pages. The Global Market Insights share is TRT Provider Guide’s calculation of $1.10B ÷ $1.90B. Verified September 3, 2026.
The three numerical observations run from 44.1% to 57.9%. Their descriptive median is 54.7%. That does not prove injections hold exactly 54.7% of the real global market because the labels, years, and models differ. One source uses “parenteral,” while the others use “injectables.”
The U.S. Food and Drug Administration lists approved testosterone forms that include oral products, topical gel, a transdermal patch, a buccal system, and injections. Market reports may group these forms in different ways, which is another reason not to pool every segment figure as though the categories were identical.
Which region has the largest TRT market?
North America is the clearest regional leader in the usable public pages. Five of the six usable pages describe North America as the largest or leading region. The sixth, Global Market Insights, lists regional coverage and a U.S. value but does not call one global region the leader in the public text, so we did not count it in the 5-of-6 finding.
| Source | Source year | Public finding | Comparable North America share |
|---|---|---|---|
| Mordor Intelligence | 2025 | North America was the largest region | 47.6% |
| Nova One Advisor | 2024 | North America dominated | Not stated publicly |
| Data Bridge Market Research | 2024 | North America led | 48.5% |
| Allied Market Research | 2022 | North America dominated | Not stated publicly |
| The Business Research Company | 2025 | North America was the largest region | Not stated publicly |
Source: Linked original producer pages; verified September 3, 2026.
The two comparable shares are 47.6% and 48.5%, a difference of 0.9 percentage points. Two observations are too few for a useful cross-source median. They also come from different models, so they should not be pooled into one official regional share.
How large is the U.S. testosterone replacement therapy market?
The public U.S. pages do not support one clean benchmark. We checked three 2024 figures. Only one page passed the same public-page integrity rule used in the global audit.
| Source | Public scope | Displayed 2024 U.S. estimate | Public-page result | Reason |
|---|---|---|---|---|
| Global Market Insights | Product-focused global report with a U.S. value | $736.1M | Passed | No material conflict found in the public U.S. value or surrounding page text |
| Custom Market Insights | Product-focused U.S. TRT report | $340.0M | Failed | The page says the U.S. median age exceeds 48 and says 36.25M people age 65+ are 29.3% of the population; Census reports 39.1, 61.2M, and 18.0% for 2024 |
| Strategic Market Research | Wider applications and end-user scope | $1.06B | Failed | The page reports a 36% North America/USA share in one section and about 38.5% in another |
Source: Linked public market pages and the U.S. Census Bureau’s Vintage 2024 population estimates. Values describe what the market pages displayed when checked on September 3, 2026.
The two product-focused displayed values differ by $396.1 million. The higher one is 2.17 times the lower one. Across all three displayed values, the high value is 3.12 times the low value.
Those spread figures describe the pages, not a confidence range. Because two of the three pages fail the public-page integrity check, this audit does not calculate a U.S. median. The defensible finding is that there is one usable public 2024 U.S. estimate in this cross-check: $736.1 million, not a stable U.S. consensus.
The global benchmark is more stable because it uses six usable estimates and all six form a tight 2025 cluster.
What changed in the U.S. regulatory setting?
The U.S. regulatory setting changed in 2025 and 2026, but official sources do not state how many market dollars those actions added or removed. The safe conclusion is that the label framework changed; a direct sales effect has not been established here.
| Date | Verified event | What it means for this market page |
|---|---|---|
| February 28, 2025 | The FDA removed language about increased cardiovascular risk from the boxed warning, kept the age-related limitation-of-use language at that time, and required blood-pressure information or warnings | A major class-wide label change; not a measured market-size increase |
| April 16, 2026 | The FDA invited sponsors to discuss applications for a possible low-libido indication in men with idiopathic hypogonadism | A regulatory pathway discussion, not approval of the new use |
| June 18, 2026 | HHS announced that FDA had requested further prescribing-information updates, including removal of the age-related limitation-of-use statement and revisions concerning prostate cancer and benign prostatic hyperplasia | A later label-policy action; the official announcement does not quantify a revenue effect |
Source: U.S. Food and Drug Administration and U.S. Department of Health and Human Services. Dates and descriptions verified September 3, 2026.
The February 2025 action followed the TRAVERSE cardiovascular-safety trial and required ambulatory blood-pressure study results to be reflected in labeling. FDA’s current testosterone information page reports major cardiovascular events in 7.0% of the testosterone group and 7.3% of the placebo group among more than 5,200 men. The original trial was published in the New England Journal of Medicine.
FDA also states that completed blood-pressure studies confirmed an increase in blood pressure across the testosterone-product class. A market page should not turn the cardiovascular finding into a broad claim that TRT is risk-free.
The official pages cited here do not give a dollar estimate for the market effect of these actions. We therefore did not add a regulatory “uplift” to the benchmark or claim that the label changes caused the forecast growth.
This article is educational market research, not medical advice. Questions about low testosterone, testing, treatment, or safety belong with a licensed health professional who knows the patient’s history.
What are the main limits of this TRT market-size data?
The benchmark is strong as a comparison of public estimates, but it is not exact realized sales data. Its best use is as a dated public-source benchmark with clear scope and limits.
| Limit | What it means |
|---|---|
| We did not find an official global sales census | $2.21B is a cross-source benchmark, not a government total |
| None of the 15 pages provides a public worldwide sale-by-sale record | The underlying market cannot be rebuilt sale by sale |
| Full report models are mostly private | Country inputs, prices, rebates, interviews, and assumptions cannot be fully checked |
| The fixed source set is not every report on the internet | A newly found eligible source could change the next version |
| Public-page integrity is not a full audit of the paid report | A failed page may still have a sound private report, and a clean page does not prove every hidden input |
| Scope differs | Product revenue, services, applications, and care settings are not always counted the same way |
| Five of six usable pages use 2024 or 2025 as a base; one uses 2022 | An older starting point requires more years of compounding |
| CAGR assumes a smooth path | Real annual sales may rise, fall, or change unevenly |
| No inflation adjustment was made | We used each source’s U.S.-dollar values as published because the pages do not provide one shared price-year basis |
| Current-year values may still be estimates | A “2026 market size” published during 2026 is not necessarily a final audited 2026 total |
| Product and regional labels differ | Segment summaries are descriptive, not pooled market shares |
| Public pages can change without notice | Every quoted value should keep its verification date |
| Regulatory dates do not prove market causation | A label change and a forecast shift can happen near each other without one proving the other |
| Market revenue is not patient count | The same revenue can come from different prices, doses, treatment lengths, or numbers of users |
Source: TRT Provider Guide methodology and direct-page audit, version 1.2.0.
How confident should a reader be in the headline?
The public evidence strongly supports $2.21 billion as the center of the usable 2026 estimates. The audit does not show that real worldwide sales were exactly that amount.
| Claim | Evidence status | Reason |
|---|---|---|
| The source pages displayed the figures shown in our tables on September 3, 2026 | Directly verifiable | Each row can be checked against the linked public page |
| The calculations and medians are reproducible from those figures | Reproducible | The formula, inclusion rules, source values, and data file are public on this page |
| About $2.21B is the center of the usable 2026 public estimates | Supported as a benchmark | The main, strict, and all-page 2026 medians stay within 0.6% |
| The real worldwide market was exactly $2.21B in 2026 | Not supported | No audited global transaction ledger is public |
| The market will be exactly $2.59B in 2030 | Not supported | That value summarizes forecasts; it is not an observed future result |
Source: TRT Provider Guide evidence-status framework for this dataset.
The correct level of precision depends on the claim. About $2.21 billion is suitable for a general 2026 benchmark. $2.2128 billion is useful only when explaining the calculation and should not be presented as an exact sales total.
How will this market-size dataset be kept current?
The benchmark should be recalculated whenever a source changes its values, scope, or public method. A full dated review is also needed when a new direct global estimate enters the source set or an excluded page fixes its conflict.
| Element | Check rule | Recalculation trigger |
|---|---|---|
| Global source values and CAGRs | Review the fixed source pages at least quarterly | Any changed base value, target value, CAGR, or forecast endpoint |
| Scope classifications | Re-read public definitions during each full review | A source adds or removes products, services, applications, or care settings |
| Excluded-page conflicts | Recheck with each quarterly review | A page resolves the conflict and passes all six checks |
| New direct public estimates | Add only through the same eligibility gate | A new original producer page reveals enough data for the global audit |
| U.S. cross-check | Recheck the displayed values and the public-page support | A source fixes a conflict or a new comparable U.S. page appears |
| FDA context | Check when FDA updates testosterone information or labeling | New official safety, indication, or label action |
| Main median, tables, data file, and schema | Recompute and update together after any source-set change | Any included row changes, enters, or leaves |
| Full edition | Run at least once each year | New calendar-year benchmark or material method change |
Source: TRT Provider Guide update policy for the TRT Market-Estimate Integrity Audit.
The visible date at the top of the page should change only after the sources and calculations have been checked again. A copy edit by itself should not create a new “last verified” date.
What else should readers know about the TRT market size?
The short answers below cover the main follow-up questions about size, growth, scope, product type, region, and the U.S. estimate. Each answer uses the same audited source set and keeps the main limit beside the number.
What is the global testosterone replacement therapy market size in 2026?
The best public-source benchmark is about $2.21 billion in 2026. It is the median of six estimates that passed a six-check audit of 15 direct public pages.
What was the global TRT market size in 2025?
The 2025 median is $2.125 billion, which rounds to $2.13 billion. All six usable 2025 estimates fall between $1.98 billion and $2.17 billion.
How large could the TRT market be by 2030?
The same six-source method gives a 2030 median of about $2.59 billion. The strict product-focused median is about $2.60 billion.
What is the expected CAGR for the TRT market?
The median stated CAGR is 4.1% a year among the six usable sources. CAGR is a smooth average growth rate, not a promise that every year will grow by the same amount.
Why is there no single official TRT market-size number?
The public sources use different scopes, prices, base years, channels, and forecast methods. This audit also did not identify an official worldwide transaction-level sales census for TRT.
Which TRT product type has the largest market share?
Injections are the most consistent leader. All five usable product-focused pages identify injections or parenteral products as the largest or leading form, and the three usable public numeric shares range from 44.1% to 57.9%.
Which region has the largest TRT market?
North America is the most consistent leader. Five of the six usable pages call it the largest or leading region. Two comparable public estimates place its share at 47.6% and 48.5%.
How large is the U.S. TRT market?
This audit does not support one neutral U.S. benchmark. Of three 2024 public figures checked, only the $736.1 million Global Market Insights page passed the same public-page integrity rule.
Does the $2.21 billion figure include online TRT clinic revenue?
Not under one shared rule. The source pages do not consistently say whether membership fees, consultations, lab work, or care-management charges are included, so this figure should not be used as the size of the online TRT clinic market.
Does this market include testosterone boosters or supplements?
The strictest public definition in the usable set excludes non-prescription testosterone boosters and dietary supplements. Other pages are less explicit, which is one reason this article shows both broad and strict sensitivity results.
Is the TRT market the same as the hormone replacement therapy market?
No. Broader hormone replacement therapy studies may also include estrogen, progesterone, menopause care, and other hormone products or services. Those broader HRT reports were not used in this TRT-only source set.
Is $2.21 billion an audited sales total?
No. It is the median of usable public estimates normalized to 2026. It should be described as an estimate or benchmark, not as an exact audited total.
Is this article medical advice?
No. It is an educational market-data reference. A licensed health professional should answer personal questions about testosterone testing, treatment, dosing, benefits, or risks.
How to cite this page
How should this page be cited?
The page can be cited as an article, and the underlying comparison can be named as the TRT Market-Estimate Integrity Audit, 2026 Edition, version 1.2.0. Keep the last-updated date with the citation because source pages and forecasts can change.
Suggested article citation
TRT Provider Guide. “Testosterone Replacement Therapy Market Size: 2026 Data Audit.” TRT Provider Guide. Last updated September 3, 2026. https://trtproviderguide.com/research/testosterone-replacement-therapy-market-size/
Suggested dataset citation
TRT Provider Guide. TRT Market-Estimate Integrity Audit, 2026 Edition. Version 1.2.0. TRT Provider Guide, September 3, 2026. https://trtproviderguide.com/research/testosterone-replacement-therapy-market-size/
Related research: Testosterone levels by age: data and reference ranges
Methods: Research and Data Methodology