TRT Statistics 2026: Use, Safety, Benefits, and Source Data
Most TRT statistics get quoted wrong because different studies count different things. Here is the strongest current number we found: an Epic Research study of 109 million men found that 0.93% of male patients who had a healthcare encounter in 2025 had an active testosterone prescription. That is 93 per 10,000, or about 1 in 108, and it is 45.3% above the 2021 rate of 0.64%.
The number to quote: In Epic Cosmos, 0.93% of male patients with a healthcare encounter had an active testosterone prescription in 2025—93 per 10,000, up 45.3% from 2021.
One limit, right up front. This is not “0.93% of all American men are on TRT.” It counts male patients who had an encounter at a health system in Epic Cosmos and had testosterone listed as active in the chart. A chart entry does not prove the prescription was filled or used.
The next number is harder to brush past. The American Urological Association guideline says “up to a third” of men placed on testosterone may not meet the criteria for testosterone deficiency. In a 2026 review of 200 men at Michigan Medicine, only 12% had the full guideline-based workup before their first prescription.
By: TRT Provider Guide · Published: September 2, 2026 · Last verified: September 2, 2026
About this page: TRT Provider Guide is an independent research and reference resource. This page has no advertising, affiliate links, or provider recommendations.
Data files: Full TRT statistics dataset · Prescribing timeline · Common-claims source ledger
TRT statistics at a glance
Each row answers a different question. The denominator is the part that keeps the number honest.
| Question | Verified number | What it actually counts |
|---|---|---|
| Male patients with an active testosterone prescription, 2025 | 0.93% (93 per 10,000) | Male Epic Cosmos patients age 18+ with a healthcare encounter |
| Change in that rate, 2021 to 2025 | +45.3% | Relative change from 0.64% to 0.93%; absolute change was 0.29 percentage points |
| Age group with the highest 2025 rate | 50–64: 1.57% | About 1 in 64 male patients in that age group who had an encounter |
| People filling testosterone in a 24-state analytic sample, 2022 | 1,656,641 | Unique people, including men and women, with at least one outpatient fill |
| Men with the full workup before their first prescription | 12% | A 200-patient Michigan Medicine chart review, 2020–2025 |
| Direct-to-consumer platforms that offered TRT to a shopper with normal results | 6 of 7 | One standardized secret shopper using seven U.S. platforms |
| Men age 45+ classified as low in the HIM primary-care study | 38.7% | One morning visit and a definition that also counted 80 men already on treatment |
| Untreated HIM participants with a measured total testosterone below 300 ng/dL | 36.3% | Our recalculation: 756 of 2,082 untreated men |
| Community men age 30–79 with low testosterone plus symptoms | 5.6% | Boston-area BACH survey data from 2002–2005 |
| Main cardiac outcome in TRAVERSE | 7.0% vs 7.3% | Testosterone gel versus placebo in selected men with low testosterone and cardiovascular risk |
| Clinical fractures in TRAVERSE | 3.50% vs 2.46% | Testosterone versus placebo over a median 3.19 years |
| Added sexual activity in the largest trial for that outcome | +0.49 acts per day at 6 months | Testosterone versus placebo; erectile function did not improve significantly |
Sources: Epic Research; Selinger and Thallapureddy, PLOS ONE; Sinha and Papaleontiou, ENDO 2026; Dubin et al., JAMA Internal Medicine; Mulligan et al., International Journal of Clinical Practice; Araujo et al., JCEM; and the TRAVERSE trial reports. Compiled and recalculated by TRT Provider Guide. Last verified September 2, 2026.
What the TRT statistics show—and what they do not
Answer capsule: Testosterone prescribing fell for much of the 2010s, then rose to the highest full-year rate in the Epic series by 2025. At the same time, several studies found weak testing before treatment. The data does not give a complete U.S. headcount, and it cannot tell us whether each prescription was right for that patient.
The 2025 Epic rate of 0.93% is 12.0% above the same series’ 2013 rate of 0.83%. Use did not just return to its old level. It passed it.
But the timing needs to stay honest. Prescribing had already started to fall after 2013. The FDA added stronger label language in March 2015. Commercial-insurance data then showed a further fall through 2016. Those facts line up in time, but the studies do not prove that the FDA action caused the whole decline.
Three plain takeaways:
- Use is rising, and it peaks in middle age. Men age 50 to 64 had the highest rate in 2025.
- “How common is low testosterone?” has no one answer. Change the population or definition and the result moves from 2.1% to 38.7%.
- Benefits and risks are outcome-specific. The same trial found gains in sexual activity and anemia, no significant gain in erectile function, no excess in its main cardiac outcome, and more fractures.
And one thing nobody can prove from the prescribing data: why use rose. Epic Research says its study describes the trend but does not explain it.
How many men use TRT in the United States?
Answer capsule: No source in this review gives a complete national headcount. The best current rate is 0.93% of male Epic Cosmos patients with a healthcare encounter in 2025. A separate 24-state study counted 1,656,641 unique people filling testosterone in 2022. Those figures measure different things and cannot be added.
TRT means testosterone replacement therapy. Hypogonadism is a medical syndrome: symptoms or signs occur with consistently low testosterone. A full workup looks for the cause, which may involve the testes, pituitary, hypothalamus, illness, obesity, or medicines.
A national count is hard for simple reasons. Insurance data misses cash-pay care. State prescription databases miss testosterone given inside a clinic. Health records do not prove a prescription was filled. No one dataset closes all of those gaps.
Three ways current sources count testosterone use
| Measure | Latest verified figure | Who is counted | What it cannot tell you |
|---|---|---|---|
| Active prescription in Epic Cosmos | 0.93% in 2025; 0.95% through June 22, 2026 | Male patients age 18+ with at least one healthcare encounter | Whether the drug was filled or used; a rate for all U.S. men |
| Filled outpatient prescription in state PDMP data | 1,656,641 people in 2022 | Unique people in the 24-state analytic sample, including men and women | A national total; diagnosis; clinic-administered doses |
| Medicare Part D claim volume | 751,976 claims in 2019 | Prescribers with at least 11 testosterone claims in a year | Unique patients; cash-pay care; claims from low-volume prescribers |
Sources: Epic Research, 2026; Selinger and Thallapureddy, PLOS ONE 2024; Sellke et al., International Journal of Impotence Research 2024. Last verified September 2, 2026.
A calculation we did not publish. It is easy to multiply 0.93% by the U.S. adult male population and create a national estimate. We did the math and threw it away. The 0.93% denominator is male patients with a healthcare encounter in Epic Cosmos, not all adult men. Stretching it across the whole country would create a clean-looking number that the source cannot support.
A prescription drug monitoring program, or PDMP, is a state database for controlled-substance prescriptions after they are dispensed. That makes it closer to a real fill count than a chart entry, but the 2024 study still had only 24 states in its final analytic sample and did not contain diagnosis data.
Are TRT statistics going up or down?
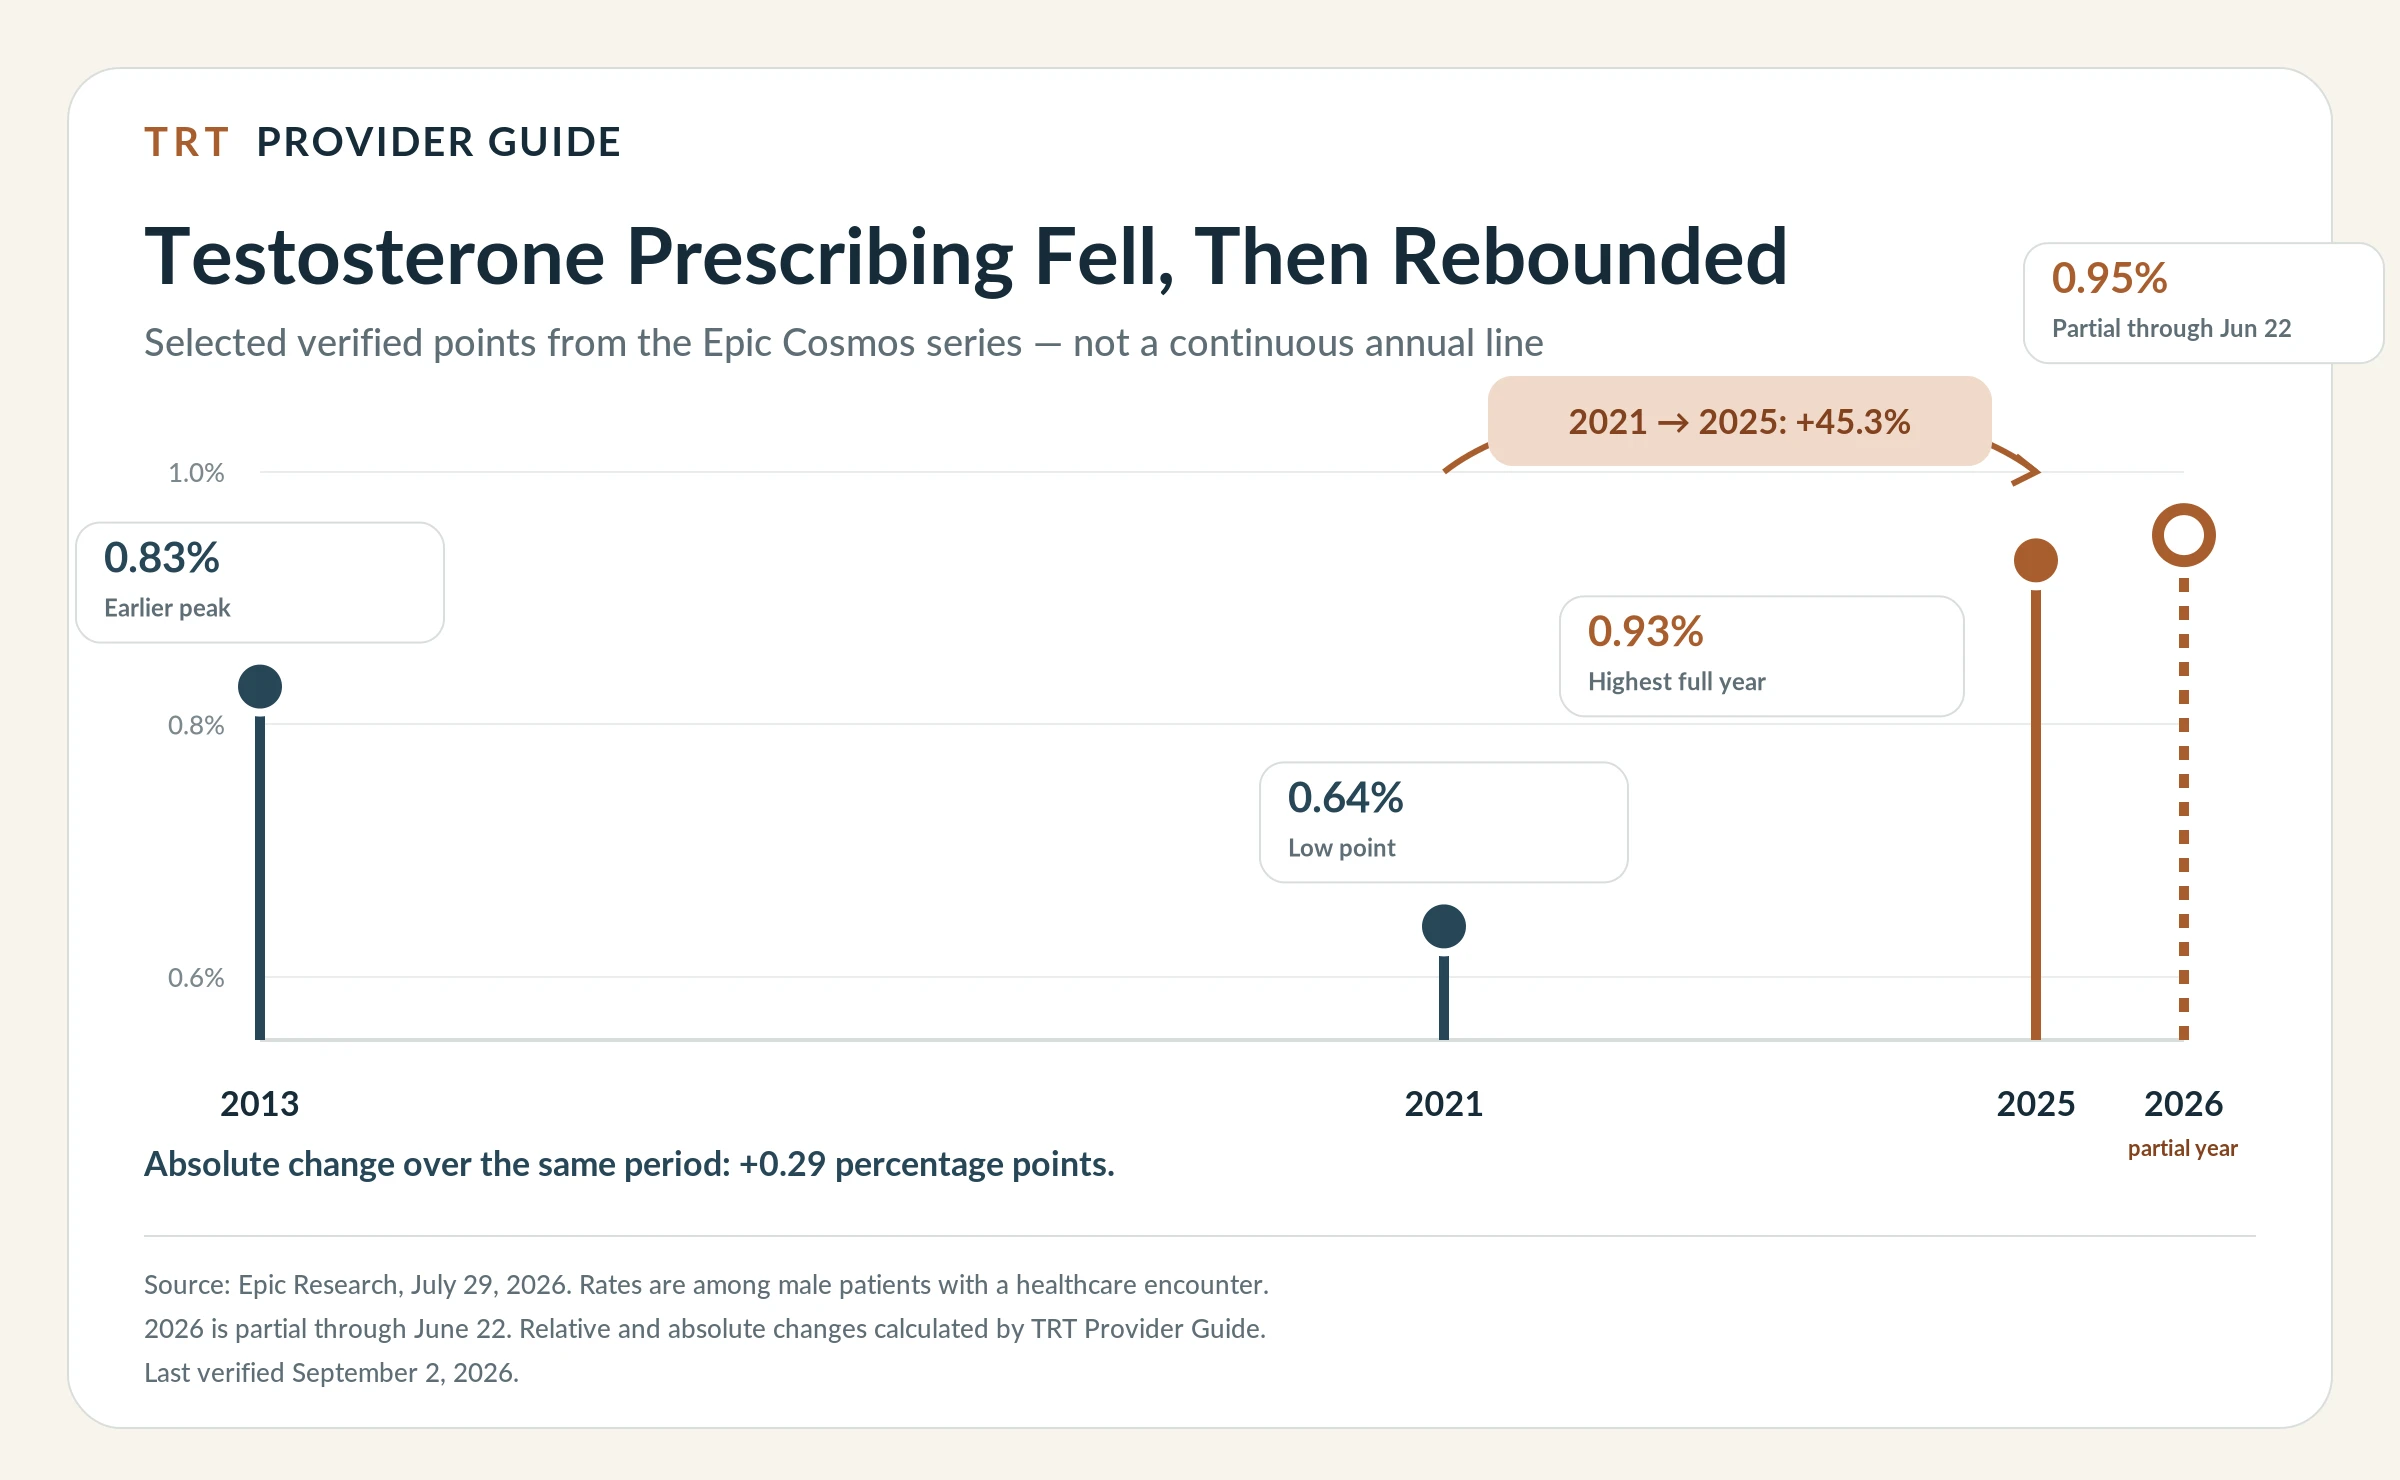
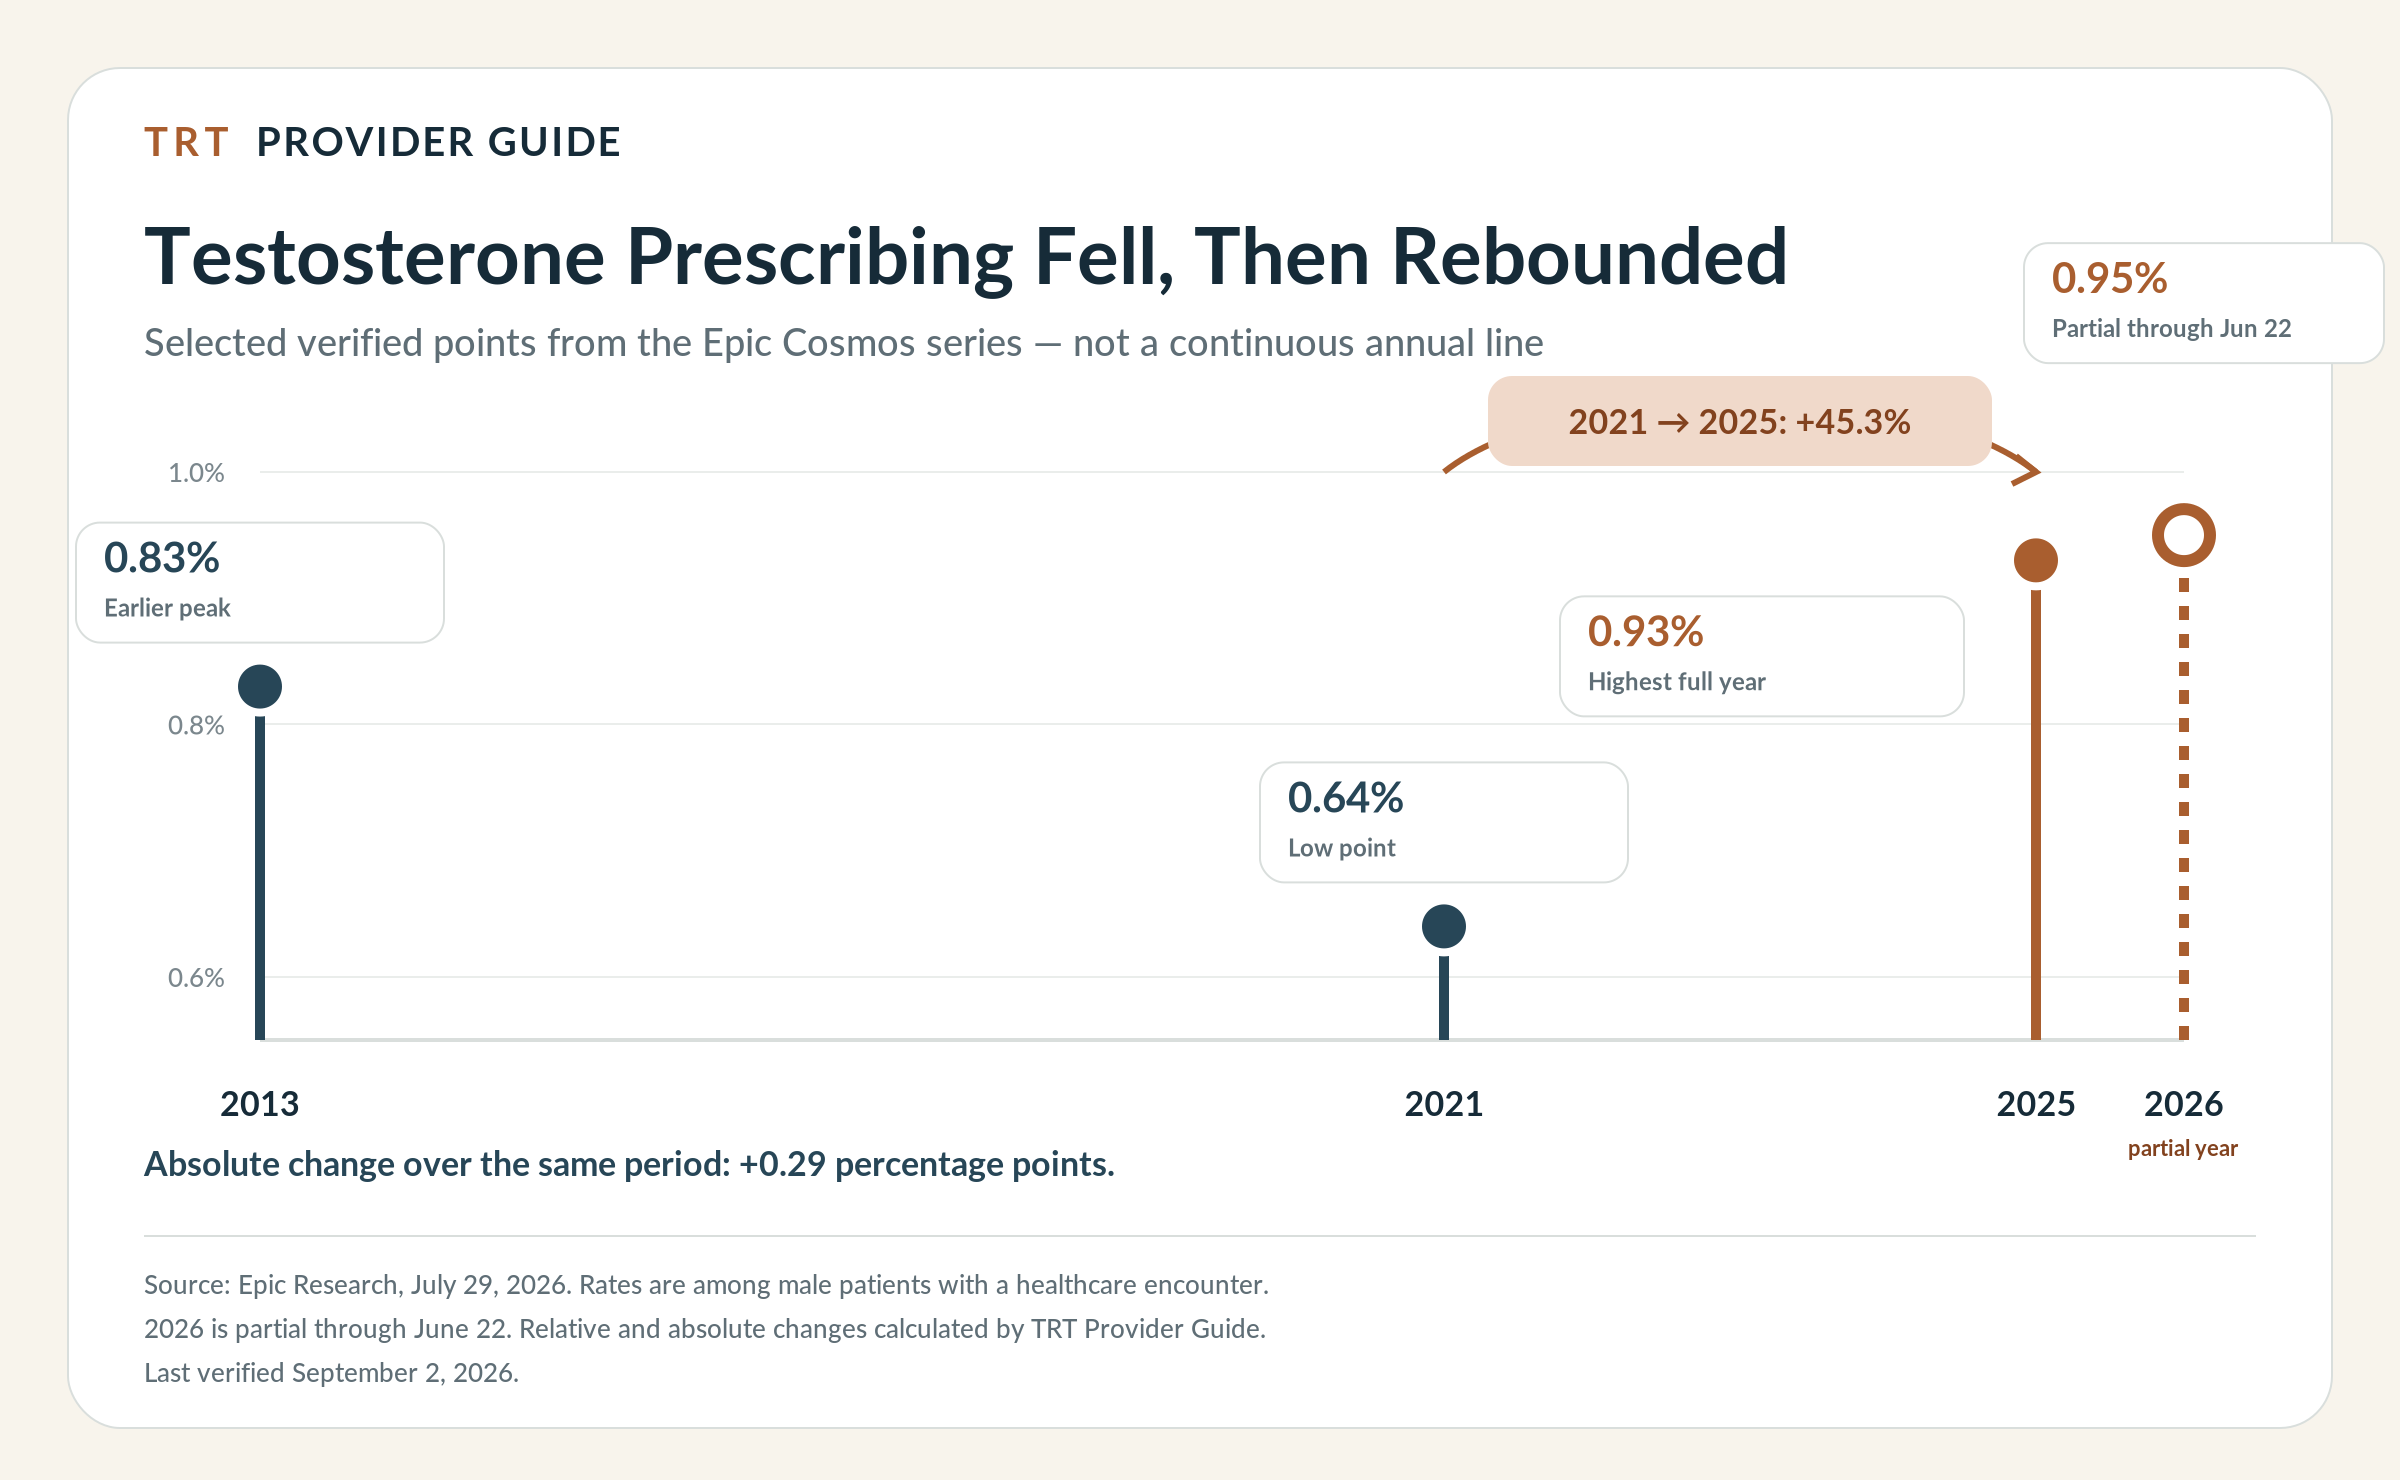
Answer capsule: Up, after a long fall. In Epic Cosmos, the rate moved from 0.83% in 2013 to 0.64% in 2021, then rose to 0.93% in 2025. That is a 45.3% relative increase from the low point and a 0.29 percentage-point absolute increase.
The current Epic health-record series
| Year | Male patients with an active prescription | Per 10,000 | Note |
|---|---|---|---|
| 2013 | 0.83% | 83 | Earlier peak in this series |
| 2021 | 0.64% | 64 | Low point, 22.9% below 2013 |
| 2025 | 0.93% | 93 | Highest full year, 45.3% above 2021 and 12.0% above 2013 |
| 2026 through June 22 | 0.95% | 95 | Partial year, not a final annual rate |
Source: Epic Research, July 29, 2026. Per-10,000 rates and relative changes calculated by TRT Provider Guide. Last verified September 2, 2026.
The headline math is:
(0.93 − 0.64) ÷ 0.64 × 100 = 45.3%
That is the relative increase. The absolute increase is 0.29 percentage points. Both are true. Print both when space allows.
Epic also says the number of contributing organizations grew over time. Early years came from a thinner health-system footprint. The series is useful, but it is not a fixed national panel.
Arithmetic audit 1: the PLOS fill-count increase
The PLOS ONE PDMP study prints a 27% increase from 1,216,982 people in 2018 to 1,656,641 in 2022.
Using the standard start-value formula gives:
(1,656,641 − 1,216,982) ÷ 1,216,982 × 100 = 36.1%
Using the ending value as the denominator gives:
439,659 ÷ 1,656,641 × 100 = 26.5%
That rounds to the paper’s 27%. The paper does not state the formula used for that sentence. The safest way to report it is the raw change: 1,216,982 to 1,656,641, up 439,659 people. When a percentage is needed, label 27% as the paper’s printed value and 36.1% as the standard recalculation.
The same paper prints a rise in population share from 0.76% to 0.98% as about 30%. That one matches the start-value formula:
(0.98 − 0.76) ÷ 0.76 × 100 = 28.9%
The two sentences in the same paper therefore appear to use different denominators.
Arithmetic audit 2: the Medicare claim increase
The Medicare study prints 542,040 testosterone claims in 2016 and 751,976 in 2019. It also prints a 54.6% increase.
Those raw counts give:
(751,976 − 542,040) ÷ 542,040 × 100 = 38.7%
A 54.6% increase would require a different starting value. We found no second denominator in the paper that reconciles the claim totals with 54.6%. This page and the data files therefore use 38.7% calculated from the published counts and preserve 54.6% only as the percentage printed by the paper.
The long view: separate sources, separate populations
| Period | What changed | Verified figure | Who was counted |
|---|---|---|---|
| 2001–2011 | Use more than tripled | 0.81% → 2.91% | Commercially insured men age 40+ |
| 2002–2013 | Use reached its peak in another claims series | 0.52% → 3.20%; new use 0.28% → 1.26% | 9,962,538 commercially insured men age 30+ |
| 2013–2016 | Use fell | 3.20% → 1.67% (48%); new use fell 62% | Same insured population |
| 2016–2019 | Medicare Part D claim volume rose | 542,040 → 751,976 (38.7% by raw counts) | Prescribers with at least 11 claims per year |
| 2018–2022 | Unique fills rose in the PDMP sample | 1,216,982 → 1,656,641 | People in the 24-state analytic sample |
| 2021–2025 | Active chart prescriptions rose | 0.64% → 0.93% | Male Epic Cosmos patients with an encounter |
Sources: Baillargeon et al., JAMA Internal Medicine 2013; Baillargeon et al., JAMA 2018; Sellke et al., International Journal of Impotence Research; Selinger and Thallapureddy, PLOS ONE; Epic Research. These series must not be joined into one continuous national line.
Who writes the prescriptions?
In the 2026 Michigan Medicine review, primary-care physicians wrote 45% of the first prescriptions, urologists 35.5%, endocrinologists 18%, and other specialists 1.5%.
Medicare data points the same way. Family medicine and internal medicine produced the most claims among physician specialties. From 2016 to 2019, the number of nurse practitioners prescribing testosterone rose 118%, and the number of physician assistants rose 78%. Advanced-practice providers’ share of claims moved from 7.5% to 11.6%.
That does not make TRT “a primary-care drug” in every setting. It does show that specialty clinics are not the whole story.
Which age group uses TRT the most?
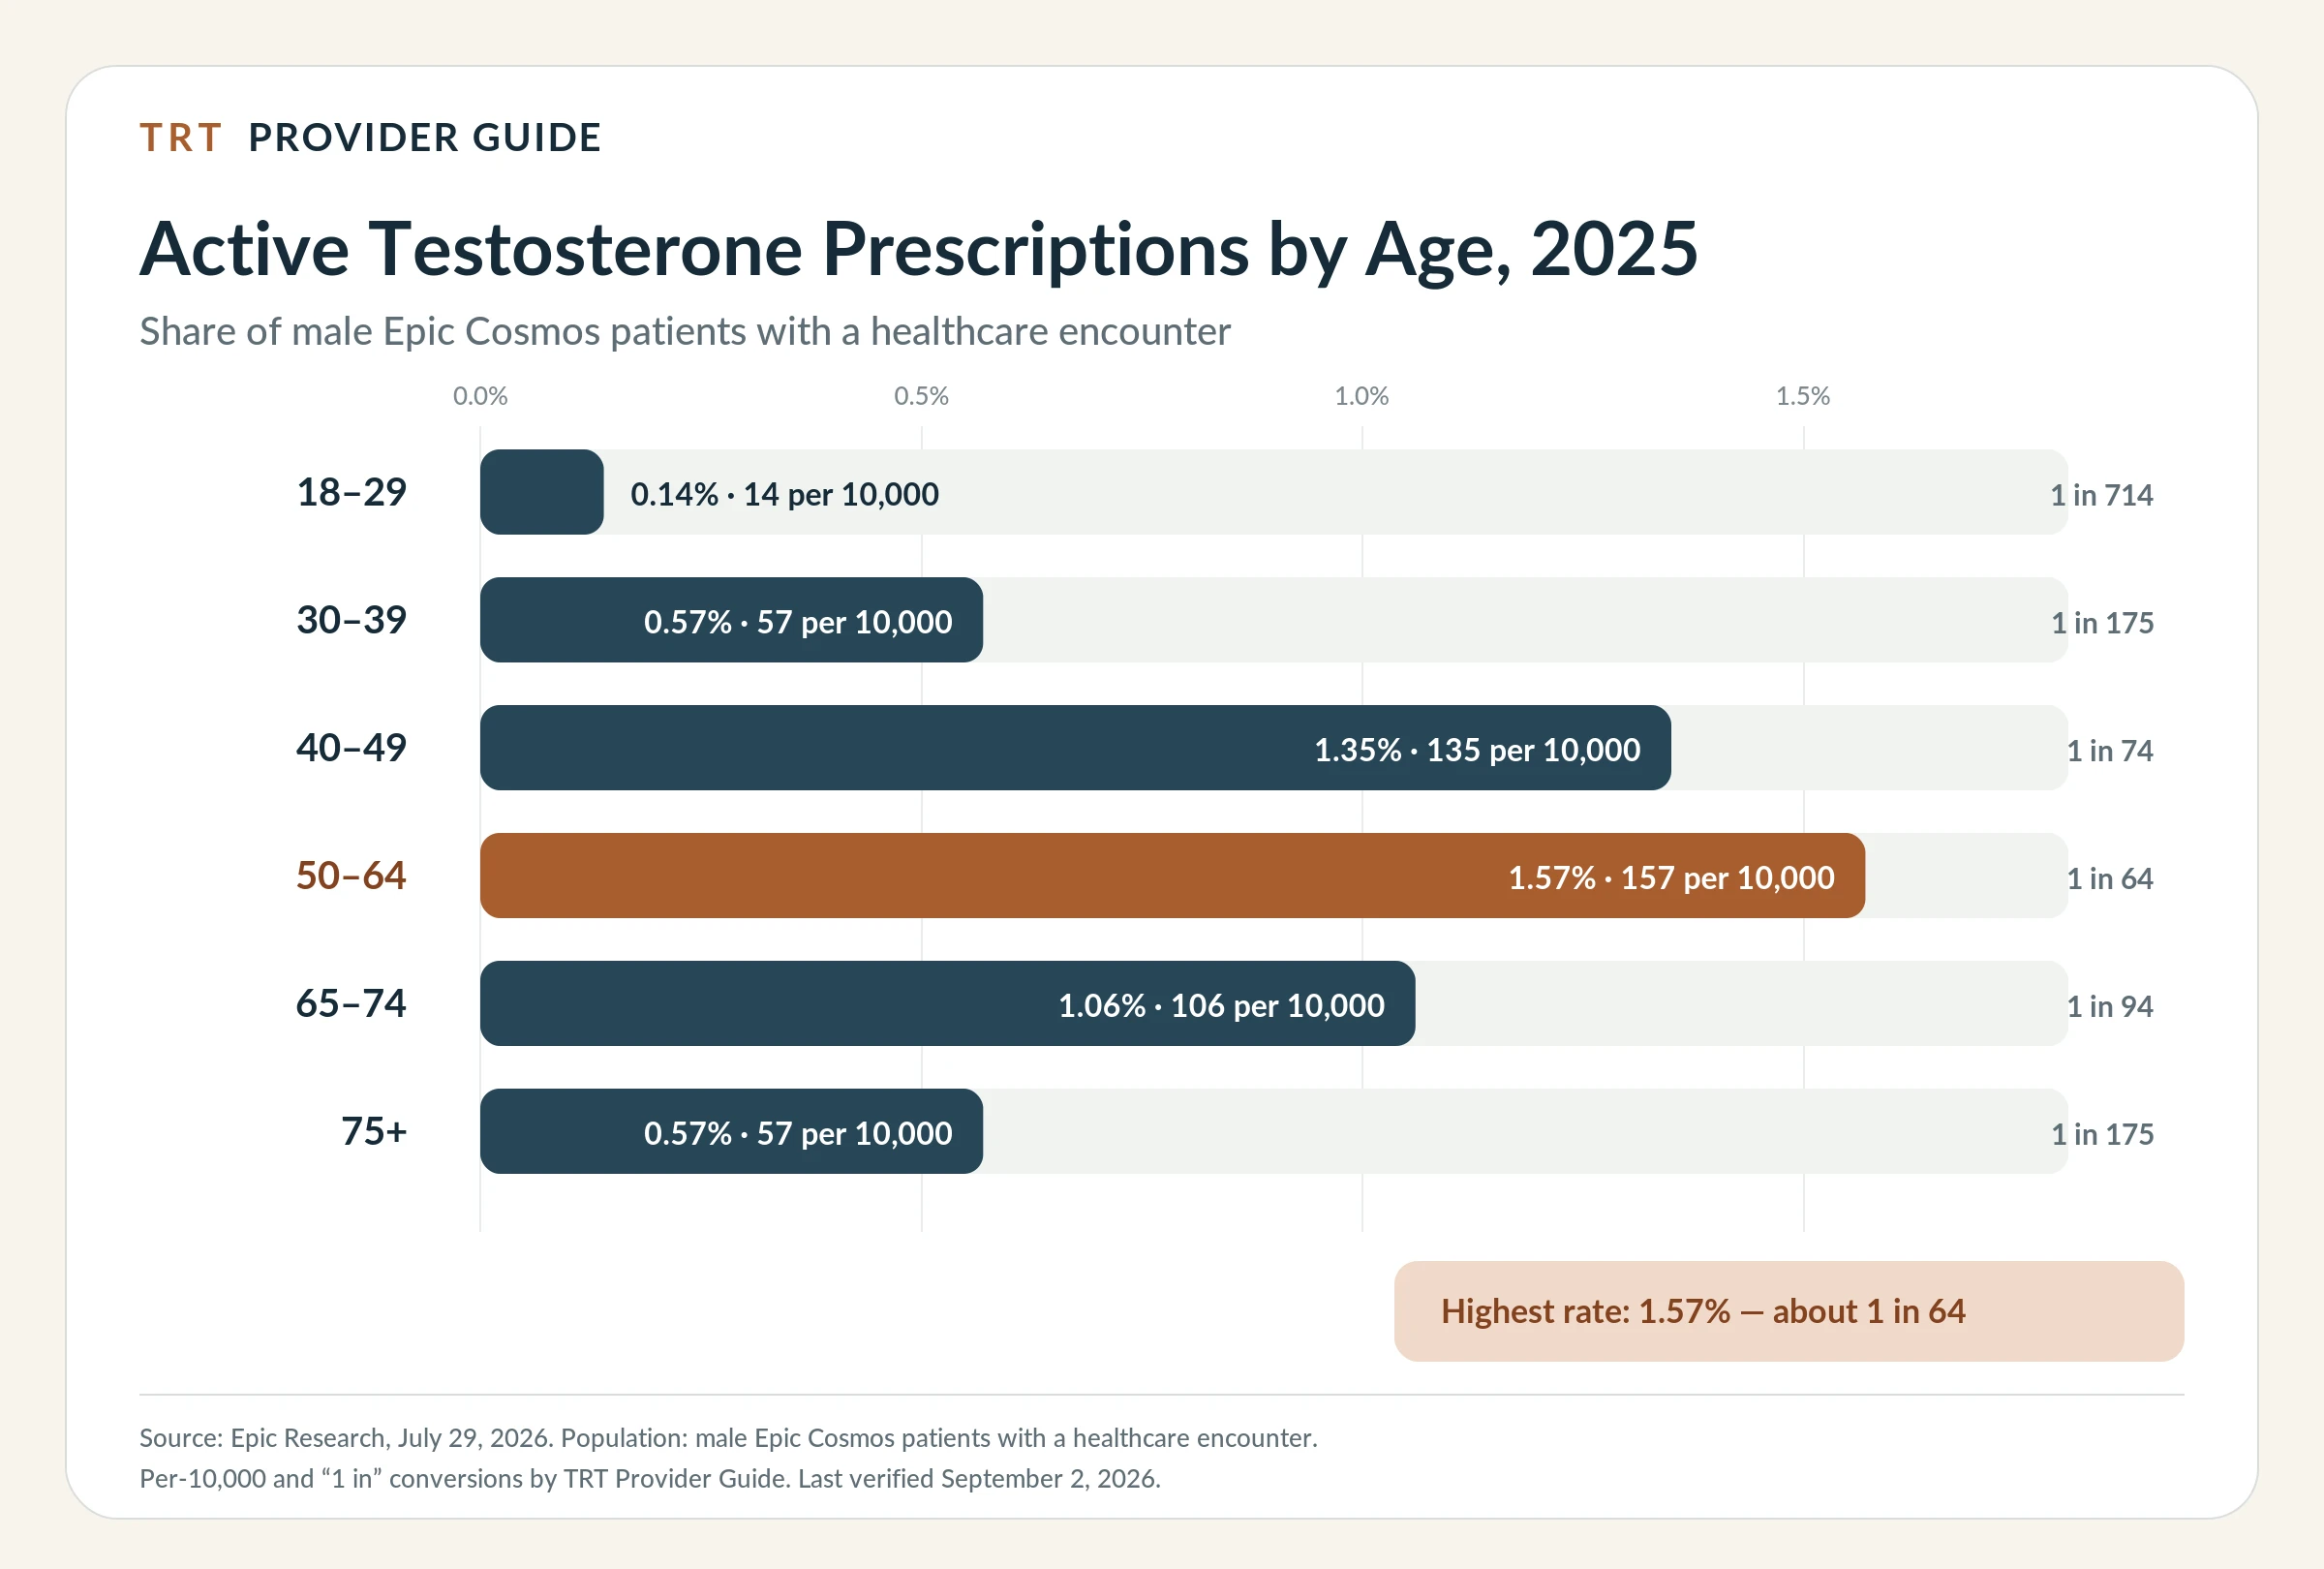
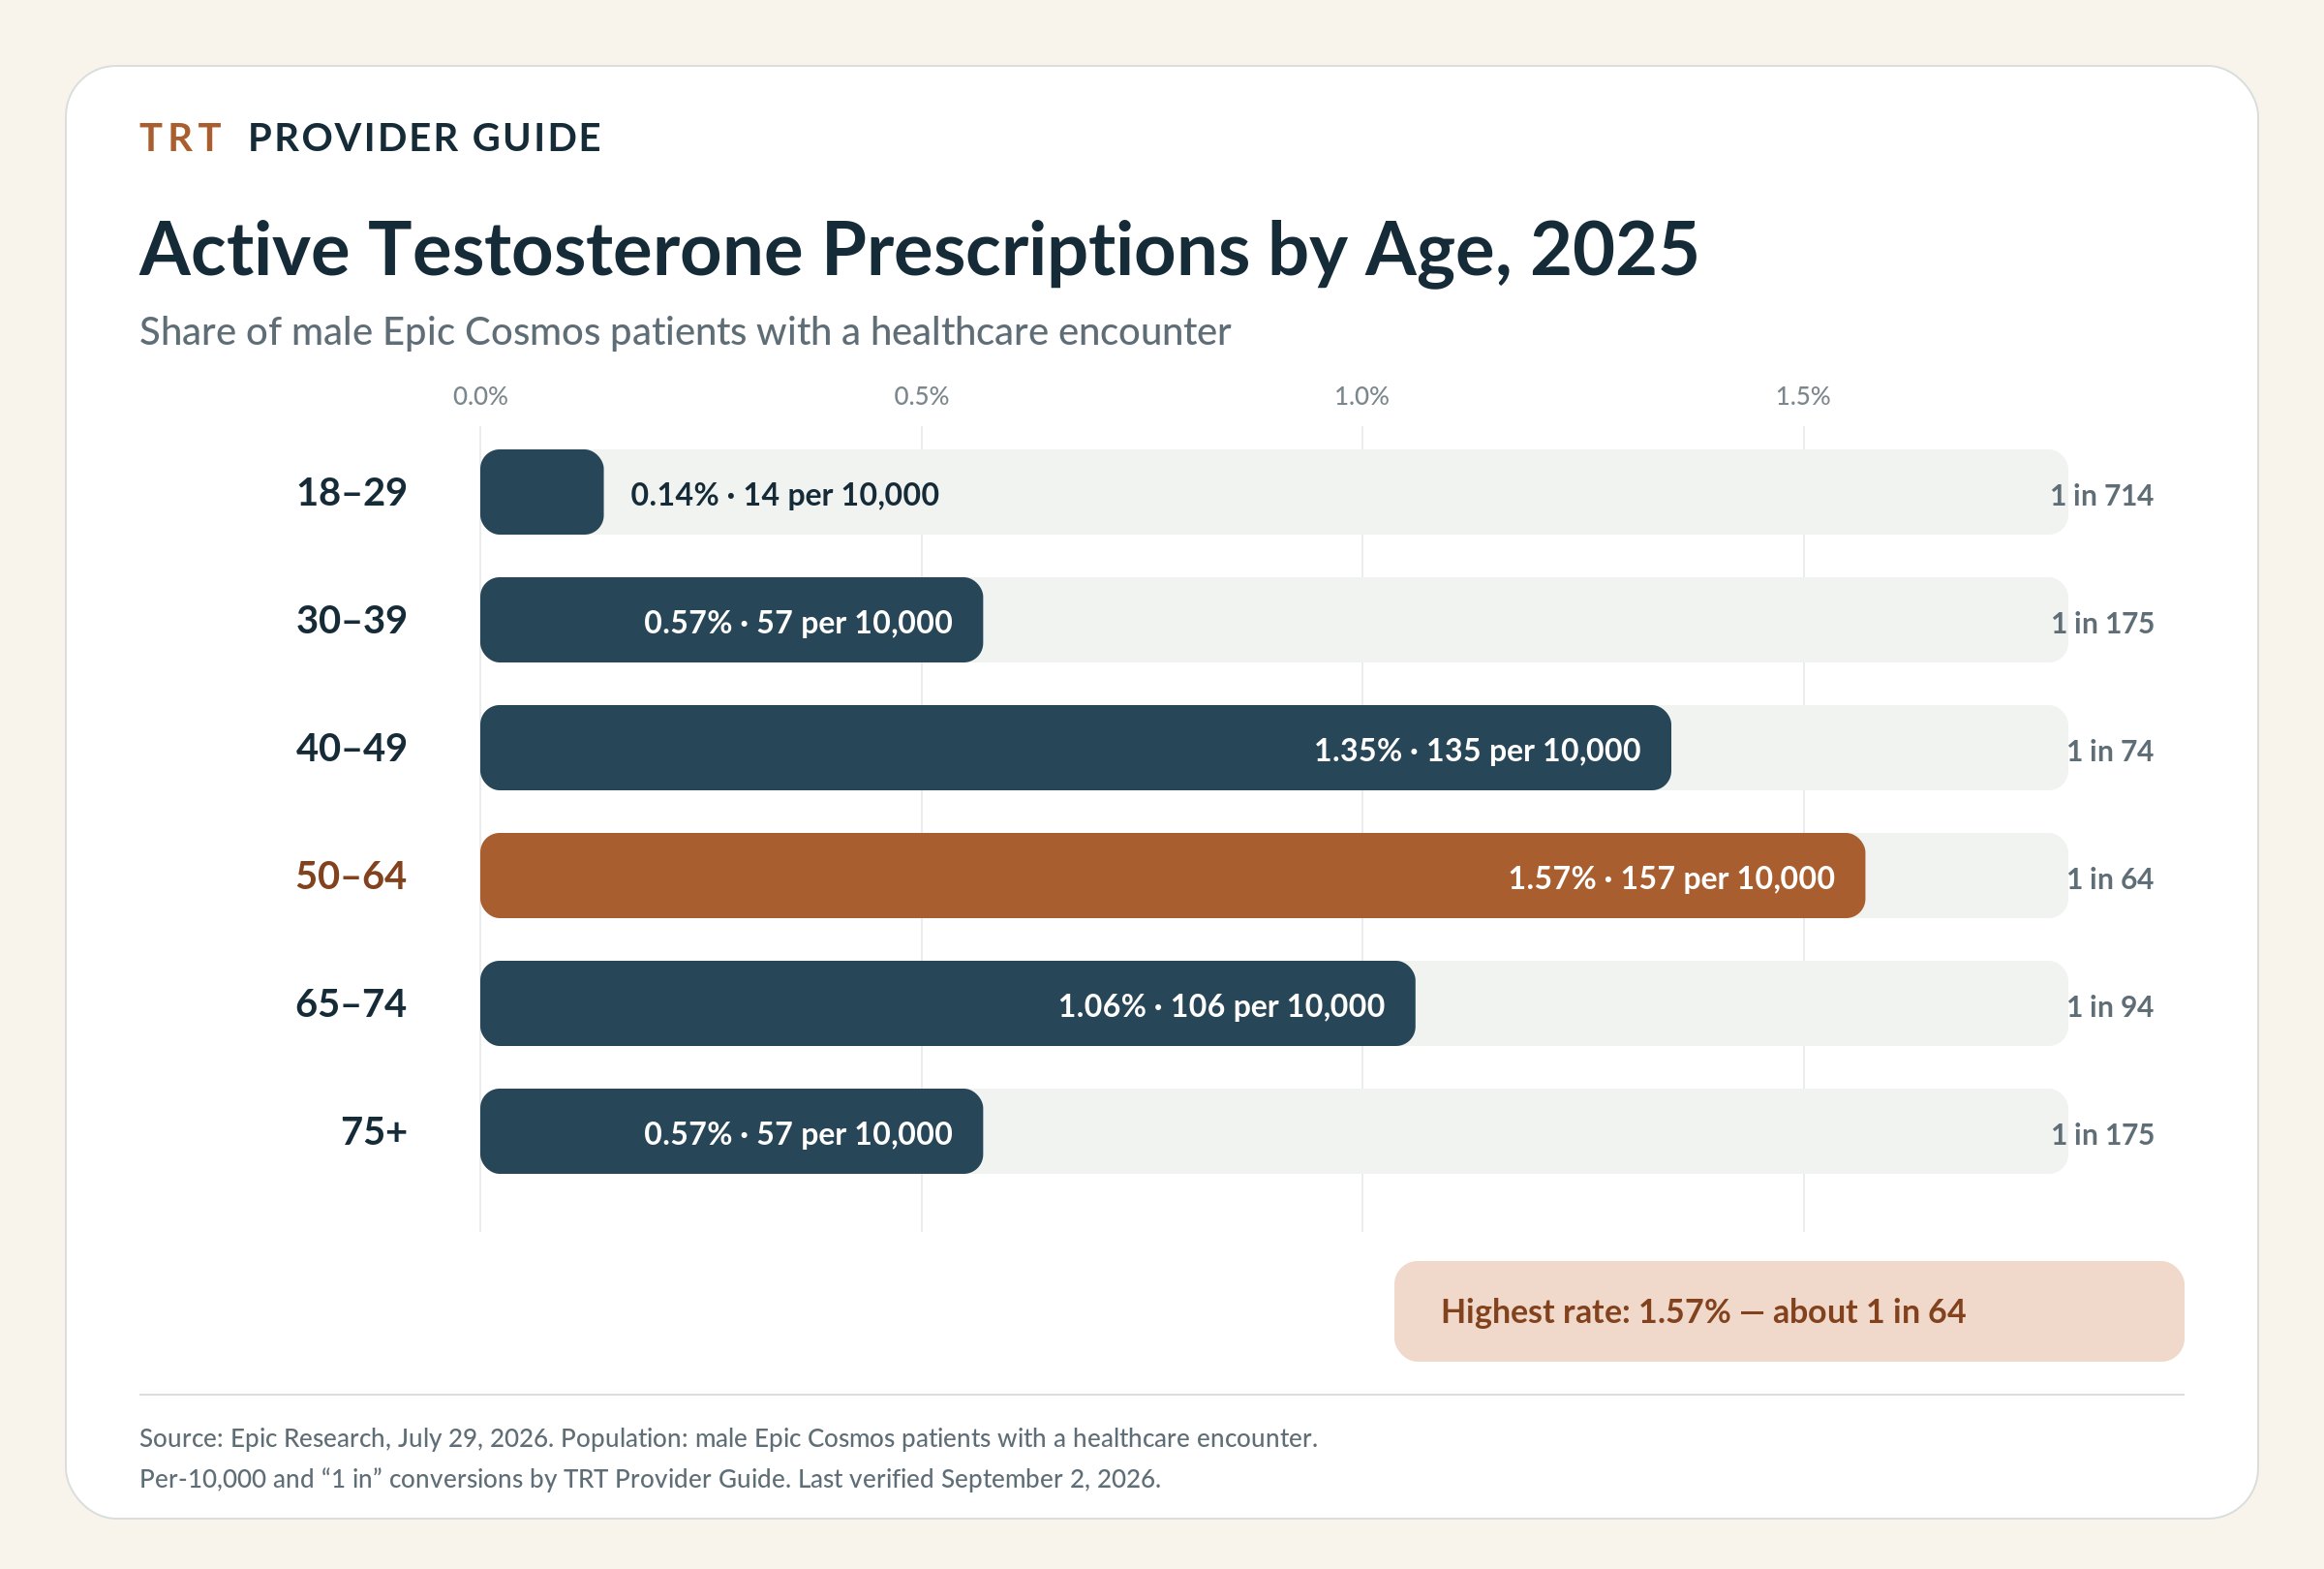
Answer capsule: Men age 50 to 64. In 2025, 1.57% of male Epic patients in that age group had an active testosterone prescription. That is 157 per 10,000, about 1 in 64, and 11.2 times the rate for men age 18 to 29.
| Age | 2025 rate | Per 10,000 | Roughly |
|---|---|---|---|
| 18–29 | 0.14% | 14 | 1 in 714 |
| 30–39 | 0.57% | 57 | 1 in 175 |
| 40–49 | 1.35% | 135 | 1 in 74 |
| 50–64 | 1.57% | 157 | 1 in 64 |
| 65–74 | 1.06% | 106 | 1 in 94 |
| 75+ | 0.57% | 57 | 1 in 175 |
Source: Epic Research, 2026, among male patients with a healthcare encounter. Per-10,000, ratio, and “1 in” conversions by TRT Provider Guide.
The highest use and the fastest growth are not the same thing. In the 24-state PDMP study, the population-adjusted share filling testosterone from 2018 to 2022 rose 120% for age 24 and younger, 86% for age 25–34, 45% for age 35–44, 35% for age 45–54, 17% for age 55–64, and 12% for age 65 and older.
A small base can grow fast and remain small. Younger groups grew faster. Men age 50 to 64 still had the highest active-prescription rate in the Epic series.
The youngest PDMP group also cannot be used as a trend for young men alone. The study included men and women, and women became the majority of testosterone patients in the group age 24 and younger over the study period. The authors linked that shift to growth in gender-affirming care.
How common is low testosterone?
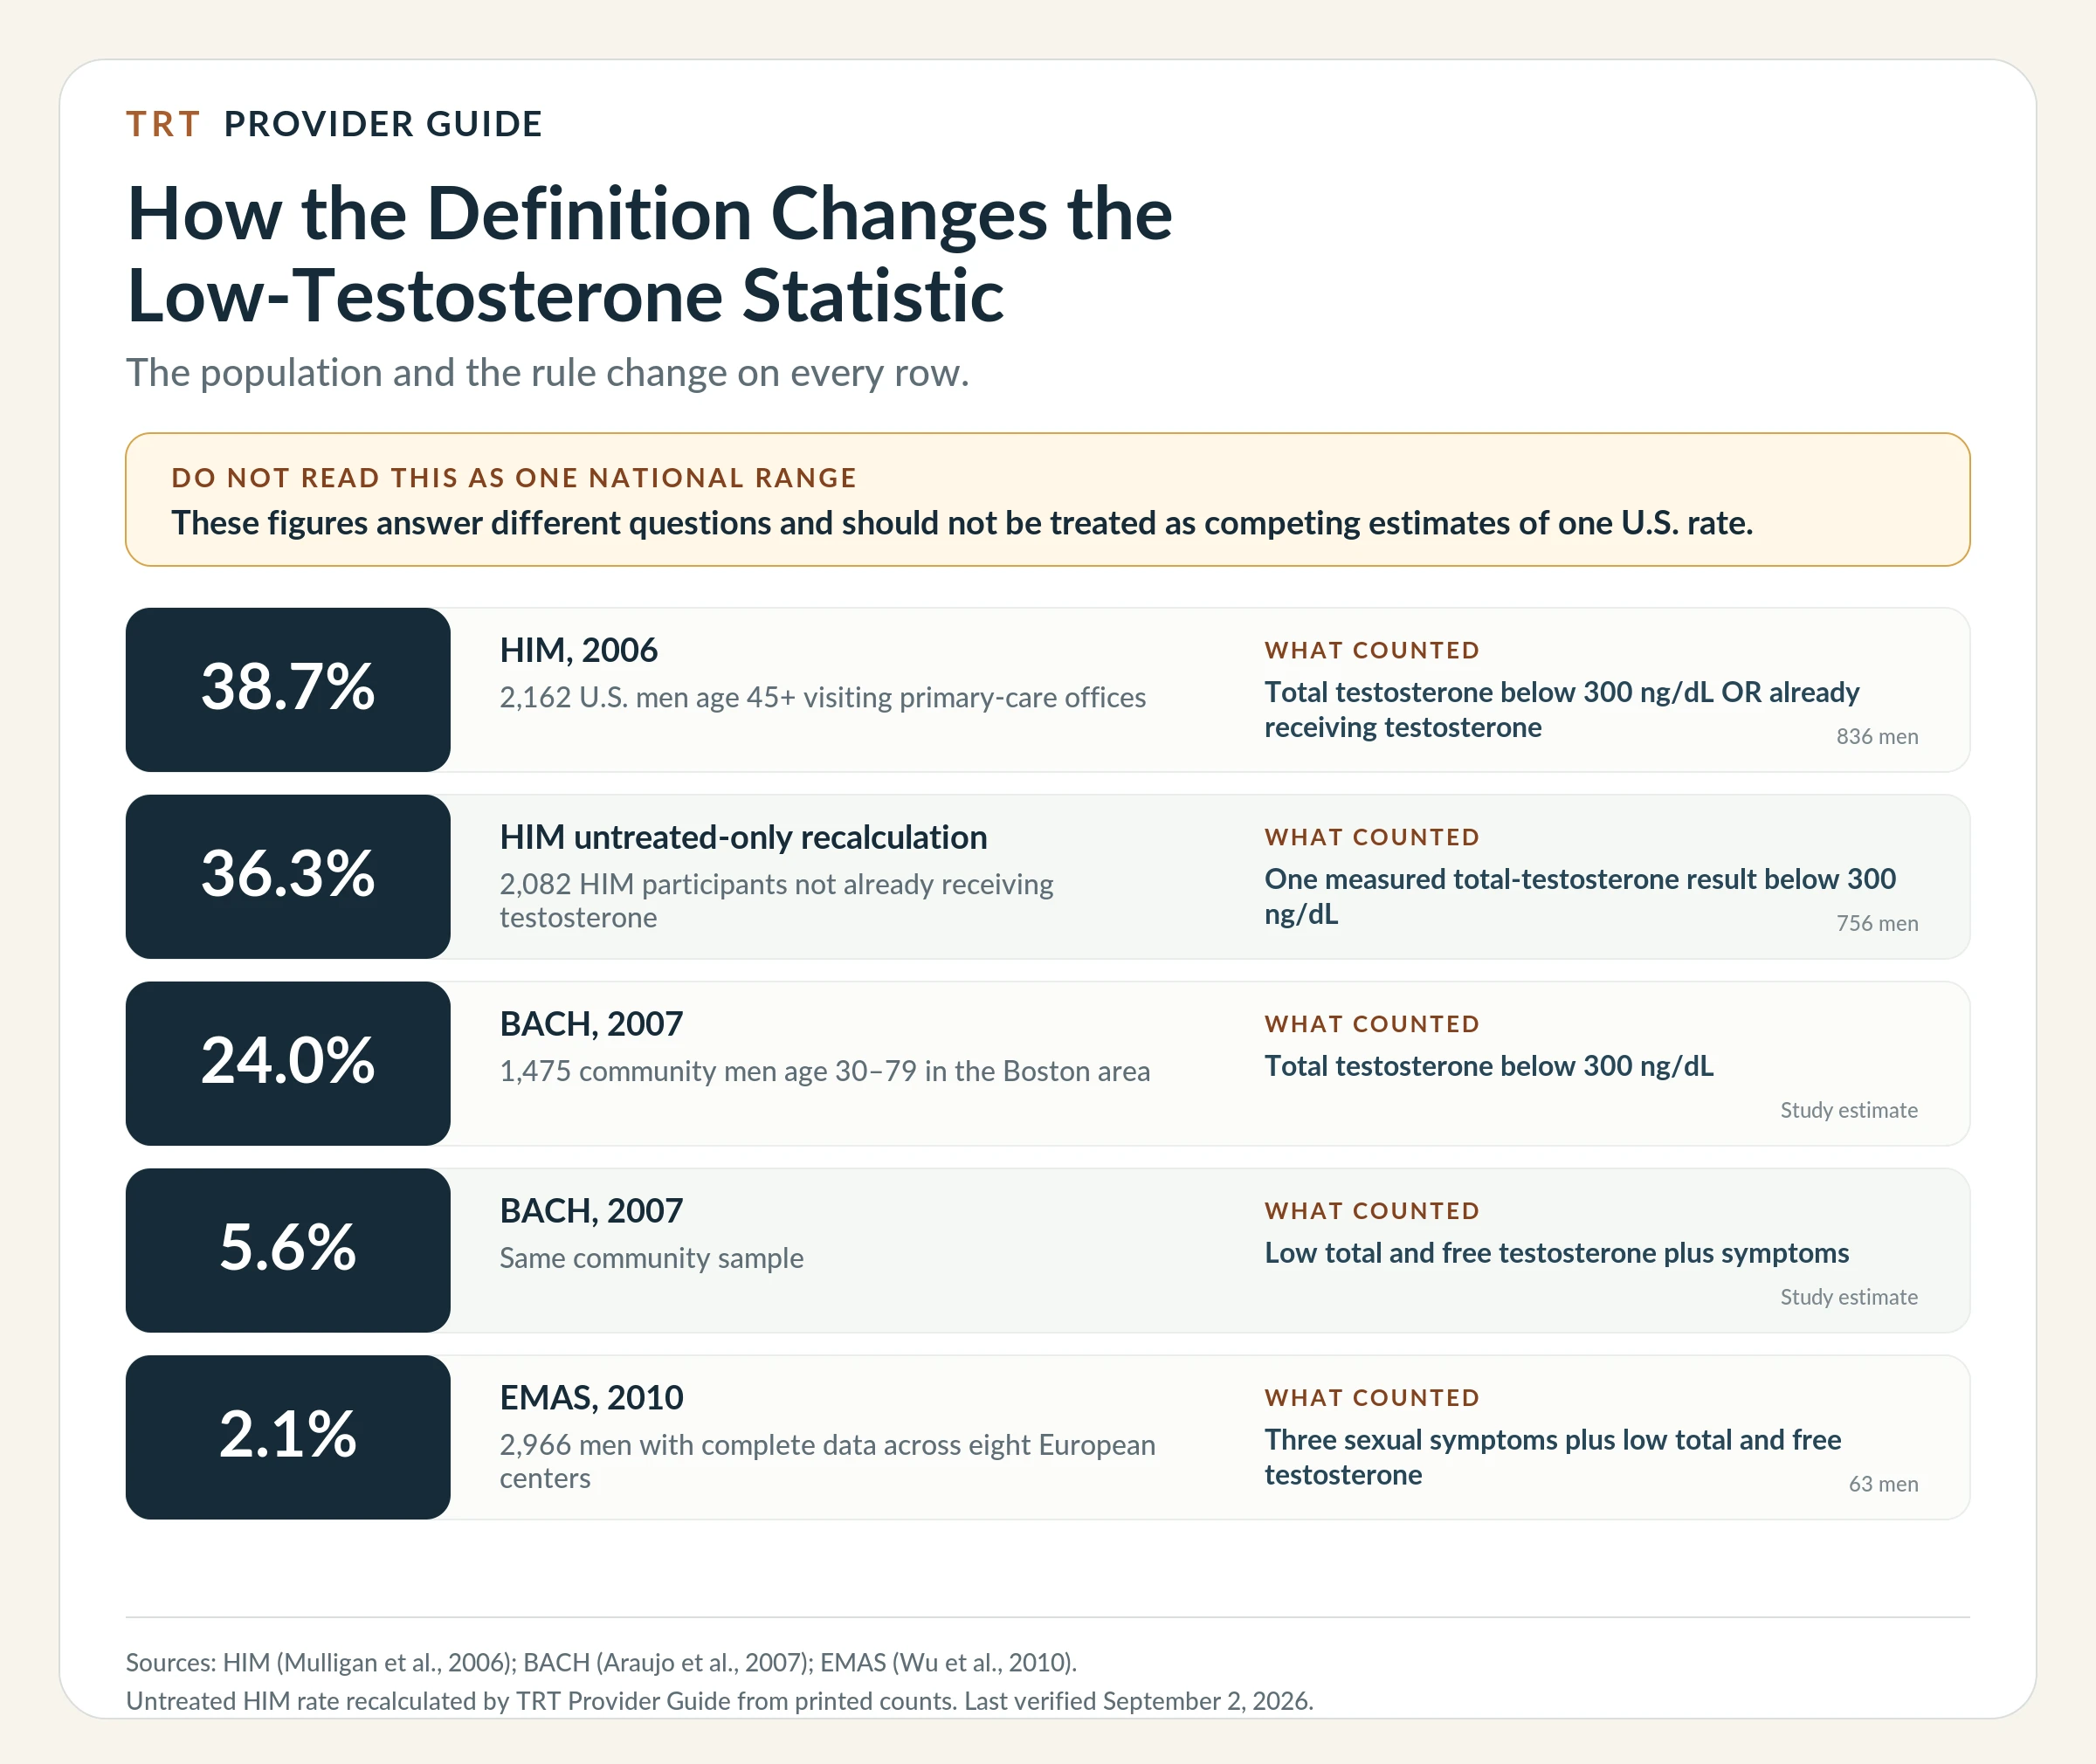
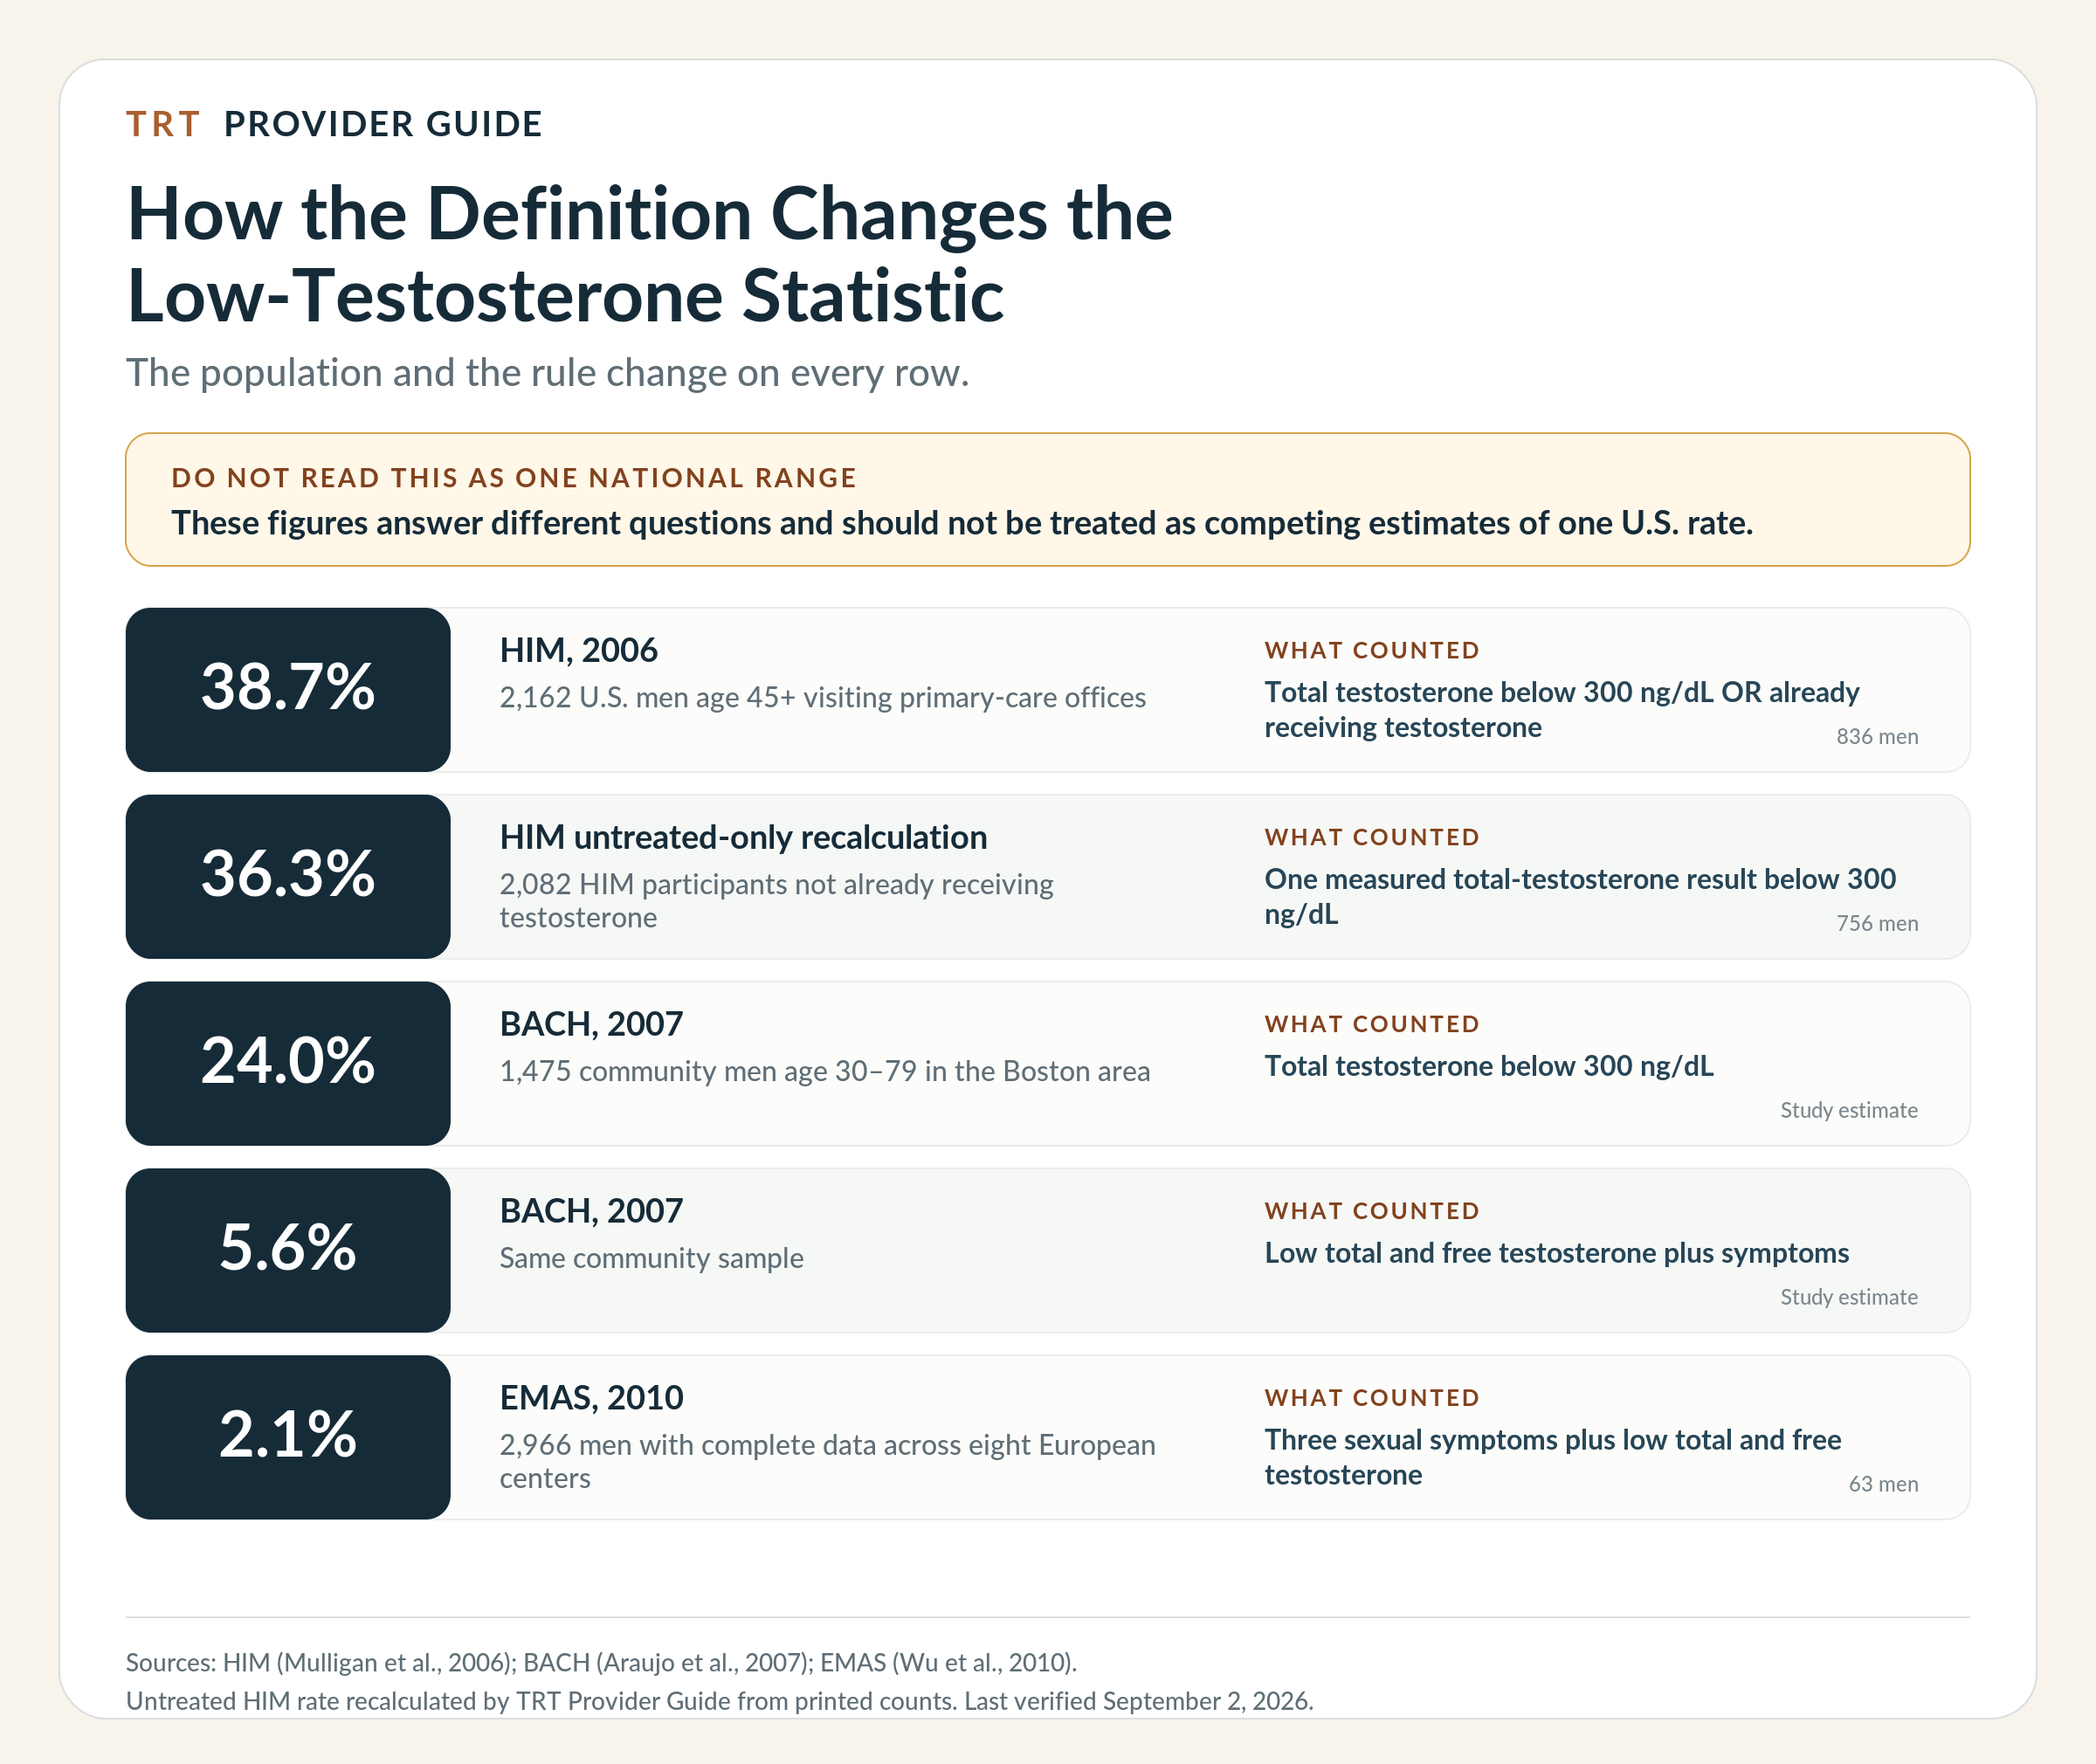
Answer capsule: The result depends on who was tested and how “low testosterone” was defined. One primary-care study classified 38.7% of men age 45+ as hypogonadal. A community study found 5.6% of men age 30–79 had low total and free testosterone plus symptoms. A European study found 2.1% under its strict symptom-and-lab definition.
| Study | Study population | Definition | Result |
|---|---|---|---|
| HIM, 2006 | 2,162 U.S. men age 45+ visiting primary-care offices | Total testosterone below 300 ng/dL or already receiving testosterone | 38.7% (836 men) |
| HIM, untreated-only recalculation | 2,082 HIM participants not already on testosterone | Measured total testosterone below 300 ng/dL | 36.3% (756 men) |
| BACH, 2007 | 1,475 community men age 30–79 in the Boston area | Total testosterone below 300 ng/dL | 24% |
| BACH, 2007 | Same community sample | Low total and free testosterone plus symptoms | 5.6% |
| EMAS, 2010 | 2,966 men with complete data from 3,369 recruited across eight European centers | Three sexual symptoms plus low total and free testosterone | 2.1% (63 men) |
Sources: Mulligan et al., International Journal of Clinical Practice 2006; Araujo et al., JCEM 2007; Wu et al., New England Journal of Medicine 2010. Untreated HIM rate calculated by TRT Provider Guide from the study’s printed counts.
The 38.7% HIM statistic needs two labels
The HIM study is real, but the popular wording “40% of men over 45 have low T” drops two facts.
First, the men were already in primary-care offices. They were not a random U.S. sample. The same paper found low testosterone was more common in men with obesity and diabetes.
Second, the study’s 836-man numerator included 80 men already receiving testosterone, whether or not their measured value at that visit was below 300 ng/dL. Remove those treated men from both sides and the measured low-testosterone rate among untreated participants is:
(836 − 80) ÷ (2,162 − 80) × 100 = 36.3%
The blood was drawn between 8 a.m. and noon. The paper does not report a fasting requirement. Current guidelines call for repeat morning testing before diagnosis.
The 2.1% EMAS statistic needs the right denominator
EMAS recruited 3,369 men. The main diagnostic analysis used 2,966 men with complete hormone and symptom data. Sixty-three met the strict definition:
63 ÷ 2,966 × 100 = 2.1%
Attaching 2.1% to all 3,369 recruited men quietly changes the denominator. The difference is small here, but the rule matters.
What current guidelines require
The American Urological Association guideline says clinicians should use total testosterone below 300 ng/dL as a reasonable cutoff, confirm it with two separate early-morning tests, and diagnose only when low levels are paired with symptoms or signs.
The Endocrine Society guideline also requires symptoms or signs plus consistently low, accurately measured testosterone, confirmed with a repeat morning fasting test.
The often-quoted 264 ng/dL number is not a universal diagnosis line. It is the 2.5th percentile in a harmonized reference range from healthy, nonobese men age 19–39. That range was 264 to 916 ng/dL and was built for assays tied to a CDC reference method. A reference limit helps interpret a lab. It does not replace symptoms, repeat testing, assay quality, or clinical judgment.
Why do TRT statistics disagree so much?
Answer capsule: Most disagreements are denominator problems. A low lab value, a diagnosed syndrome, an active prescription, a filled prescription, and a trial outcome are five different facts. Label the fact and the disagreement usually clears up.
We call this denominator drift.
| Type of number | Example | What it measures | What it cannot prove |
|---|---|---|---|
| Low lab value | Untreated HIM participants, 36.3% | One measured result below a cutoff | A full diagnosis or need for treatment |
| Diagnosed syndrome | BACH, 5.6% | Low total and free testosterone plus symptoms | A current 2026 national rate |
| Active prescription | Epic, 0.93% | Testosterone listed as active in a chart | A fill, use, diagnosis, or national headcount |
| Filled prescription | PDMP, 1,656,641 | A person had an outpatient prescription dispensed | A national total, male-only count, or clinical need |
| Treatment outcome | TRAVERSE, 7.0% vs 7.3% | One outcome in one trial population using gel | The same result for every form, dose, age, or patient |
Sources: HIM, BACH, Epic Research, Selinger and Thallapureddy, and Lincoff et al. Framework and table by TRT Provider Guide.
Before using a number, ask five questions: What was counted? Who was counted? What year? What definition was used? What can the number not prove?
Every row in the downloadable dataset carries those fields, a source URL, a verification date, and a caveat.
How many men get the recommended tests before TRT?
Answer capsule: In a 2026 review of 200 men at Michigan Medicine, only 12% had the full guideline-based workup before their first prescription. In a separate secret-shopper study, 6 of 7 direct-to-consumer platforms offered testosterone even though the shopper’s testosterone results were normal.
Michigan Medicine chart review
The ENDO 2026 study reviewed a random sample of 200 males assigned at birth, with a mean age of 52.5, who received a first outpatient testosterone prescription from 2020 through 2025.
To count as the full workup, the chart had to show:
- two low testosterone results drawn from 5 a.m. to 10 a.m.;
- luteinizing hormone and/or follicle-stimulating hormone testing, which helps find the cause; and
- no listed contraindication to testosterone therapy.
| What was documented | Share of 200 patients |
|---|---|
| Full workup above | 12% |
| PSA in the prior year | 62% |
| Complete blood count in the prior year | 77% |
Source: Sinha and Papaleontiou, ENDO 2026, presented June 13, 2026. This is a one-system retrospective chart review reported at a conference, not a national estimate.
The same review found obesity in 63%, obstructive sleep apnea in 55%, high blood pressure in 52%, depression in 40%, diabetes in 28%, and arthritis in 28%. Four percent had prior prostate cancer, and 1.5% had a PSA above 4 ng/mL before the prescription.
That is useful evidence, but it has a clear weight: one health system, 200 charts, and conference-level reporting. We treat the direction as important and the national size as unknown.
Direct-to-consumer secret shopper
A 2022 JAMA Internal Medicine study used one standardized secret shopper with normal testosterone results and a stated wish to preserve future fertility.
| Finding across seven U.S. platforms | Result |
|---|---|
| Platforms that offered testosterone | 6 of 7 |
| Platforms that asked about recent cardiovascular events | 1 of 7 |
| Platforms that asked about future fertility | 1 of 7 |
| Prescribing platforms that set a target testosterone at or above 1,000 ng/dL | 3 of 6 |
| Prescribing platforms that did not discuss polycythemia | 5 of 6 |
Source: Dubin et al., JAMA Internal Medicine 2022. This was one shopper and seven platforms, so it is a direct snapshot, not a prevalence estimate for the whole industry.
The two studies do not prove how often poor workups happen nationwide. They do show that the problem exists in both a large academic system and direct-to-consumer care.
There is also an undertreatment problem. In the older BACH community survey, only 12.2% of men who met the study’s full definition of symptomatic androgen deficiency were receiving treatment. Overtreatment and undertreatment can happen at the same time, to different men.
Does TRT work? What the large trials measured
Answer capsule: There is no one TRT success rate. Testosterone improved sexual activity and desire, corrected anemia in more men than placebo, and helped some older men on selected measures. It did not significantly improve erectile function in the largest sexual-function trial, and the main vitality outcome in the Testosterone Trials was not significant.
Sexual activity, desire, and erections
The TRAVERSE Sexual Function Study included 1,161 men with low libido: 587 assigned to testosterone gel and 574 to placebo. Mean age was 63.7.
| Outcome | Testosterone result versus placebo |
|---|---|
| Sexual activity at 6 months | +0.49 acts per day (95% CI 0.19 to 0.79) |
| Sexual activity at 12 months | +0.47 acts per day (95% CI 0.11 to 0.83) |
| Sexual desire | Improved significantly |
| Hypogonadal symptoms | Improved significantly |
| Erectile function | No significant improvement |
Source: Pencina et al., Journal of Clinical Endocrinology & Metabolism 2024.
That last row is easy to lose. Testosterone helped these men want sex more and have it more often. It did not show a significant benefit for erections in this trial.
Anemia
In TRAVERSE, 815 of 5,204 men had anemia at the start. The corrected paper reports these rates of anemia remission:
| Visit | Testosterone | Placebo | Absolute difference |
|---|---|---|---|
| 6 months | 41.0% (143/349) | 27.5% (103/375) | +13.5 points |
| 12 months | 45.0% (152/338) | 33.9% (122/360) | +11.1 points |
| 24 months | 42.8% | 30.9% | +11.9 points |
| 36 months | 43.5% | 33.2% | +10.3 points |
| 48 months | 44.6% | 39.2% | +5.4 points |
Source: Pencina et al., JAMA Network Open 2023, with the journal correction published January 23, 2024. Six-month counts also match ClinicalTrials.gov record NCT03518034.
The correction matters. Some early coverage paired 143 of 349 with 122 of 360 at six months. But 122 of 360 is 33.9%, the 12-month placebo value. The corrected six-month placebo count is 103 of 375, or 27.5%.
The Testosterone Trials in older men
The earlier Testosterone Trials enrolled 790 men age 65+ with two morning values averaging below 275 ng/dL and treated them for one year.
Sexual activity and desire improved. The main vitality outcome did not improve significantly. The main walking outcome did not improve significantly inside the Physical Function Trial, although the pooled analysis across all three main trials did show a difference.
Researchers screened 51,085 men to enroll 790:
51,085 ÷ 790 = 64.7
That is about 65 men screened for every one enrolled. It is not a prevalence estimate. It shows how selective this trial population was.
What a usable benefit claim needs
A benefit number needs four parts: the outcome, the population, the time point, and the comparison group. “TRT works for 80% of men” has none of them. Without those four parts, the percentage is decoration.
Does TRT raise heart attack or stroke risk?
Answer capsule: In TRAVERSE, testosterone gel was noninferior to placebo for the prespecified composite of cardiovascular death, nonfatal heart attack, and nonfatal stroke: 7.0% versus 7.3%. That result applies to selected men age 45–80 with symptoms, two fasting testosterone values below 300 ng/dL, and cardiovascular disease or high risk. It does not prove that every form or dose is “heart-safe.”
TRAVERSE randomized 5,246 men at 316 U.S. sites; 5,204 were included in the main analysis. The treatment was 1.62% testosterone gel, adjusted to a target of 350 to 750 ng/dL. Mean treatment time was 21.7 months, and mean follow-up was 33.0 months.
Noninferior means the trial met a preset test showing testosterone was not unacceptably worse than placebo for the main outcome. It does not mean testosterone protects the heart.
| Outcome | Testosterone | Placebo | Absolute difference |
|---|---|---|---|
| Main cardiac composite | 7.0% (182) | 7.3% (190) | −0.3 points |
| Atrial fibrillation | 3.5% (91) | 2.4% (63) | +1.1 points |
| Acute kidney injury | 2.3% (60) | 1.5% (40) | +0.8 points |
| Pulmonary embolism | 0.9% (24) | 0.5% (12) | +0.4 points |
| Nonfatal arrhythmia needing intervention | 5.2% (134) | 3.3% (87) | +1.9 points |
Source: Lincoff et al., New England Journal of Medicine 2023. Main-outcome hazard ratio 0.96, 95% CI 0.78 to 1.17. Absolute differences calculated by TRT Provider Guide.
Atrial fibrillation, acute kidney injury, and pulmonary embolism occurred more often in the testosterone group. These were not the prespecified primary endpoint, and the trial was not built to settle every secondary safety signal on its own. They still belong beside the main result. Leaving them out turns a narrow result into a blanket claim.
About six in ten participants stopped the assigned gel: 61.4% in the testosterone group and 61.7% in the placebo group. That high and nearly equal discontinuation rate is another limit on how far the result should be stretched.
What other TRT risks showed up in the trials?
Answer capsule: The clearest unexpected signal was fracture: 3.50% on testosterone versus 2.46% on placebo. Prostate-cancer events were too rare to settle long-term risk. Testosterone can also raise hematocrit and blood pressure, which is why lab and blood-pressure monitoring remain part of care.
Fractures
The TRAVERSE fracture study followed the 5,204 men for a median 3.19 years. Clinical fractures occurred in 3.50% of men assigned to testosterone and 2.46% assigned to placebo.
- Testosterone: 91 fractures
- Placebo: 64 fractures
- Hazard ratio: 1.43
- 95% confidence interval: 1.04 to 1.97
- Absolute difference: 1.04 percentage points
Testosterone can raise bone density. It did not lower the real-world fracture outcome in this trial. That is why a better lab marker cannot stand in for the event patients care about.
Prostate outcomes
The TRAVERSE prostate substudy followed a screened population over 14,304 person-years.
| Outcome | Testosterone | Placebo |
|---|---|---|
| Any prostate cancer | 0.46% (12/2,596) | 0.42% (11/2,602) |
| High-grade prostate cancer | 0.19% (5/2,596) | 0.12% (3/2,602) |
Source: Bhasin et al., JAMA Network Open 2023.
The differences were not statistically significant, but the event counts were tiny. The authors said the data should not be read as proof that the risks are equal.
The trial also excluded men at higher baseline risk, including men with prior prostate cancer, a prostate nodule, severe urinary symptoms, or PSA above its study limits. Prostate cancer can take years to appear. Short-term low event counts do not close the long-term question.
Hematocrit and blood pressure
Testosterone can cause erythrocytosis, meaning too many red blood cells. The Endocrine Society guideline uses hematocrit above 54% as the point to stop therapy, check for low oxygen or sleep apnea, and restart at a lower dose after the level falls. The guideline also calls for hematocrit checks before treatment, after 3 to 6 months, and then yearly.
There is no one honest “erythrocytosis rate” for all TRT. The result changes with the form, dose, blood level reached, patient age, study threshold, and follow-up time. A single range made from unlike thresholds and treatment forms would look precise but would not describe one shared outcome, so it is not used here.
In February 2025, the FDA required class-wide label changes after ambulatory blood-pressure studies found increases across testosterone products. The agency removed the cardiovascular boxed-warning language and added or strengthened blood-pressure warnings at the same time.
What happens to fertility, and how many men stay on TRT?
Answer capsule: Exogenous testosterone suppresses sperm production. Recovery is common after stopping, but it can take months and the best recovery data comes from healthy men in contraception studies, not long-term TRT patients. Persistence is also low in two very different datasets: 17% met a topical-therapy adherence threshold at 12 months, and about 61% stopped assigned gel in TRAVERSE.
| Statistic | Verified number | Population |
|---|---|---|
| Model-estimated sperm recovery to 20 million/mL after stopping | 67% by 6 months; 90% by 12; 96% by 16; 100% by 24 | 1,549 healthy, eugonadal men in 30 hormonal-contraception studies |
| Median recovery time in that pooled analysis | 3.4 months | Same population |
| Topical-therapy users meeting the study’s adherence threshold at 12 months | 17% (538/3,184) | Commercially insured initiators, mean age 49 |
| Participants who stopped assigned study gel in TRAVERSE | 61.4% testosterone; 61.7% placebo | 5,204 selected trial participants |
Sources: Liu et al., Lancet 2006; Grabner et al., Journal of Sexual Medicine 2018; Lincoff et al., New England Journal of Medicine 2023.
The AUA/ASRM male infertility guideline says testosterone monotherapy should not be prescribed to men interested in current or future fertility. The Endocrine Society also recommends against starting testosterone when fertility is planned in the near term.
The recovery table should not be turned into a promise. Those men were healthy and took hormones for a defined study period. Age, starting sperm count, length of treatment, and the drug used affected recovery. A man who used TRT for years is not the same population.
The adherence number also needs its real label. The 17% figure means 17% met that paper’s adherence threshold at 12 months. It does not prove that 83% permanently quit treatment, felt no benefit, or stopped every form of TRT.
Are men’s testosterone levels falling?
Answer capsule: A published analysis of U.S. NHANES samples found mean total testosterone in males age 15–39 fell from 605.39 ng/dL in 1999–2000 to 451.22 ng/dL in 2015–2016, about 25.5%. But the survey cycles used three assay methods, so the size of the biological decline cannot be separated cleanly from measurement change.
| NHANES cycle | Mean total testosterone |
|---|---|
| 1999–2000 | 605.39 ng/dL |
| 2003–2004 | 567.44 ng/dL |
| 2011–2012 | 424.96 ng/dL |
| 2013–2014 | 431.76 ng/dL |
| 2015–2016 | 451.22 ng/dL |
Source: Lokeshwar et al., European Urology Focus 2021, analysis of 4,045 males age 15–39 in NHANES.
The raw change is:
(451.22 − 605.39) ÷ 605.39 × 100 = −25.5%
The authors reported that the trend remained after adjustment for several health and lifestyle factors. The assay issue still stays beside the result. NHANES used different methods across the cycles, and the harmonized-reference-range study showed that assay differences can explain a meaningful part of variation between testosterone datasets.
An older longitudinal study, the Massachusetts Male Aging Study, also found a birth-cohort effect: men measured in later calendar years had lower average testosterone than same-age men measured earlier. That points in the same direction, but it does not give one fixed annual decline that applies to every man.
We found no single “testosterone falls X% each year” number strong enough to publish as a universal rate. The estimate changes with age, cohort, adjustment, and whether total, free, or bioavailable testosterone is measured.
What changed in U.S. testosterone policy in 2025 and 2026?
Answer capsule: The FDA removed cardiovascular boxed-warning language in February 2025 and added a class-wide blood-pressure warning. In June 2026, HHS said FDA was requesting more label updates, including removal of the age-related limitation and changes to prostate and enlarged-prostate language. “Requested” is not the same as every product label already being changed.
| Date | Verified action | What it means |
|---|---|---|
| March 3, 2015 | FDA required label language stating that benefit and safety were not established for age-related low testosterone and warned of possible heart attack and stroke risk | The agency narrowed the approved-use message and required a large safety trial |
| February 28, 2025 | FDA removed cardiovascular boxed-warning language, added TRAVERSE results, kept the age-related limitation, and required blood-pressure warning changes | The main cardiac-warning language changed, but blood pressure became a class-wide focus |
| June 18, 2026 | HHS announced that FDA was requesting removal of the age-related limitation and updates to prostate-cancer and benign-prostatic-hyperplasia information | These were requested labeling changes; product labels update through their own regulatory actions |
| July 16, 2026 | Endocrine Society restated diagnosis rules and said long-term safety, including prostate safety, remains unestablished | The Society did not treat the label request as a reason to screen symptom-free men or skip repeat testing |
Sources: U.S. Food and Drug Administration, February 28, 2025; U.S. Department of Health and Human Services, June 18, 2026; Endocrine Society, July 16, 2026. Last verified September 2, 2026.
The clean current summary is:
- The 2025 FDA action was a class-wide labeling change.
- The June 2026 announcement described requested further changes.
- The Endocrine Society still says diagnosis requires symptoms plus consistently low, accurately measured testosterone, and it does not support population screening of asymptomatic men.
This page does not claim that every product label already carries every requested 2026 revision. A product-specific claim should be checked against that product’s current FDA label.
How big is the TRT market?
Answer capsule: There is no open, reproducible 2026 market total in the primary sources we reviewed. The strongest public historical benchmark is a 41-country study that found global testosterone sales rose 12-fold, from $150 million in 2000 to $1.8 billion in 2011.
The Medical Journal of Australia study used IMS Health wholesale sales for every testosterone product in 41 countries.
| Historical market measure | 2000 | 2011 | Change |
|---|---|---|---|
| Global testosterone sales across 41 countries | $150 million | $1.8 billion | 12-fold |
| Countries with a progressive rise in per-capita use | — | 37 of 41 | 90.2% of countries studied |
Source: Handelsman, Medical Journal of Australia 2013. Dollar figures are wholesale sales, not patients, prescriptions, profit, or a current market valuation. The 90.2% figure is our calculation from 37 of 41.
The paper treated sales as a stand-in for prescribing and converted products into defined monthly doses. It also stated the assumptions: a steady relation between purchase, prescribing, and use, and a similar adult-male share across countries.
We do not print a current multibillion-dollar market estimate from a paid forecast or a news story. Those estimates use different product scopes and are not reproducible from public underlying data. The honest current answer is that a verified open total is not available here.
20 common TRT claims checked against primary sources
This ledger replaces a vague “most quoted” list. We did not run a quote-frequency study, so we do not claim these are the 20 most repeated claims on the internet. They are 20 common claims that can be checked against the original source.
| # | Common claim | What the primary source supports | Verdict |
|---|---|---|---|
| 1 | “About 1 in 100 men is on TRT.” | 0.93% of male Epic patients with an encounter had an active chart prescription in 2025. | Needs denominator |
| 2 | “TRT use is up 45% since 2021.” | 0.64% to 0.93% in Epic Cosmos; 45.3% relative, 0.29 points absolute. | Supported for that series |
| 3 | “Testosterone fills rose 27% from 2018 to 2022.” | Paper prints 27%; raw counts give 36.1% by the standard formula. | Source mismatch |
| 4 | “Medicare testosterone claims rose 54.6% from 2016 to 2019.” | Paper prints 54.6%; 542,040 to 751,976 gives 38.7%. | Source mismatch |
| 5 | “Testosterone use tripled from 2001 to 2011.” | 0.81% to 2.91% among commercially insured men age 40+. | Supported with population |
| 6 | “The FDA warning cut use in half.” | Insured use fell 48% from the 2013 peak to 2016; the data shows timing, not full causation. | Needs qualifier |
| 7 | “40% of men over 45 have low T.” | HIM classified 38.7% of primary-care patients; that numerator included 80 treated men. Untreated measured rate was 36.3%. | Needs population and definition |
| 8 | “Only 2% of men have low T.” | EMAS found 2.1% under a strict symptom-plus-lab definition in 2,966 men with complete data. | Definition-specific |
| 9 | “About 5% to 6% of men have symptomatic low T.” | BACH found 5.6% among community men age 30–79 using low total and free testosterone plus symptoms. | Supported for that study |
| 10 | “Up to a third of men on TRT never qualified.” | The AUA guideline uses “up to a third” in its background discussion of inappropriate treatment. | Guideline-supported estimate |
| 11 | “Only 12% get the full workup first.” | 12% in one 200-patient Michigan Medicine chart review reported at ENDO 2026. | Supported, not national |
| 12 | “Most online TRT clinics prescribe with normal labs.” | Six of seven platforms offered TRT to one standardized shopper with normal results. | Supported snapshot, not industry rate |
| 13 | “TRT is heart-safe.” | Gel was noninferior for one main cardiac composite in selected high-risk men; AF, AKI, and PE occurred more often. | Blanket claim not supported |
| 14 | “The FDA removed the black-box warning.” | Cardiovascular boxed-warning language was removed in 2025; blood-pressure warnings were added and the age limitation was retained at that time. | Supported with additions |
| 15 | “TRT causes prostate cancer.” | Short-term TRAVERSE event counts were low and inconclusive; long-term risk remains unsettled. | Not established |
| 16 | “TRT raises fracture risk.” | 3.50% vs 2.46% in TRAVERSE; HR 1.43. | Supported for that trial |
| 17 | “TRT fixes erectile dysfunction.” | No significant erectile-function benefit in the largest sexual-function trial, though desire and activity improved. | Contradicted as a blanket claim |
| 18 | “TRT makes men permanently infertile.” | Sperm recovery was common after stopping in healthy contraception-study participants, but time varied and guidelines still warn against use when fertility is desired. | Blanket claim not supported |
| 19 | “Only 17% stay on TRT for a year.” | 17% met one study’s adherence threshold for topical therapy at 12 months. | Needs the adherence definition |
| 20 | “Young men’s testosterone fell 25%.” | NHANES analysis found a 25.5% mean decline, but assay methods changed across cycles. | Supported with assay caveat |
Primary sources: Epic Research; PLOS ONE; Sellke et al.; Baillargeon et al.; HIM; BACH; EMAS; AUA; ENDO 2026; Dubin et al.; TRAVERSE reports; FDA; Liu et al.; Grabner et al.; and Lokeshwar et al. Full URLs, denominators, dates, and notes are in the downloadable ledger and full dataset.
How we built this page
Answer capsule: Every publishable number came from an original study, trial record, regulator, guideline body, or original data producer. We recorded the denominator, date, source URL, confidence, and caveat. We recalculated any derived figure from printed source values and did not pool unlike populations.
What we let in
A source qualified when it was one of these:
- an original peer-reviewed study;
- a clinical-trial report or registry record;
- an issuing regulator or government department;
- a specialty guideline body; or
- the producer of the underlying dataset.
A number also had to carry enough detail to label what was counted and who was counted. We excluded clinic testimonials, vendor outcome claims, paid market forecasts, and secondary numbers whose underlying report could not be checked.
The arithmetic
We used three basic formulas:
- Relative change:
(new − old) ÷ old × 100 - Rate per 10,000:
percentage ÷ 100 × 10,000 - Absolute difference:
treatment percentage − comparison percentage
We did not merge active prescriptions, filled prescriptions, low lab values, diagnoses, trial outcomes, claims, or sales into one rate. We did not turn an encounter-based rate into a national headcount.
The checks done by hand
Four findings on this page come from recomputing or reconciling the source itself:
- PLOS arithmetic: 1,216,982 to 1,656,641 is 36.1% by the standard start-value formula, while the paper prints 27%.
- Medicare arithmetic: 542,040 to 751,976 is 38.7%, while the paper prints 54.6%.
- HIM treated-patient adjustment: removing the 80 men already on testosterone changes the untreated measured rate from the paper’s 38.7% classification to 36.3%.
- Anemia correction: the corrected six-month placebo result is 103 of 375, or 27.5%; 122 of 360 belongs to month 12.
The first three are original calculations from published source values. The fourth is a source-version check against the journal correction and trial registry.
Confidence labels used in the data file
- High: peer-reviewed primary report, official agency action, registry record, or original data producer with a clear denominator.
- Moderate: original conference report or a narrow study with a small sample that still reports its method clearly.
- Excluded: underlying source unavailable, denominator unclear, source conflict unresolved, or claim outside what the study measured.
Authorship and review
The visible byline is TRT Provider Guide. No medical reviewer is claimed. This is educational reference material, not a diagnosis or treatment plan.
What this data cannot tell you
Answer capsule: No dataset here can say exactly how many U.S. men use TRT or how many prescriptions are appropriate. The safety trial tested gel in a selected older population. The best U.S. symptom-plus-lab prevalence estimate is based on data collected more than 20 years ago.
- No national user count exists in these public sources. Each system misses cash pay, in-office treatment, nonparticipating states, or people outside its health systems.
- The prescribing datasets do not pair every prescription with a full clinical diagnosis. They cannot measure appropriateness.
- Epic is not a fixed panel. Its contributing organizations grew over time, and early years have thinner representation.
- The PDMP study is a 24-state analytic sample. It includes men and women, has no diagnosis, and misses clinic-administered testosterone.
- The strongest U.S. symptomatic-prevalence estimate is old. BACH used 2002–2005 data.
- TRAVERSE tested gel in men age 45–80 with low testosterone and cardiovascular disease or risk. It does not settle injections, higher targets, younger men, or long-term use.
- About six in ten TRAVERSE participants stopped assigned treatment. That limits how far results can be stretched.
- The 12% workup figure is one health system and conference-level evidence. It is not a national percentage.
- Testosterone assays are not interchangeable. That limits comparisons across years, labs, and cohorts.
- The 2026 Epic figure is partial. It covers data through June 22, not a full year.
- The 2026 HHS label announcement described requested changes. Product-specific wording must be checked on the current product label.
How to cite this page
These are neutral publication details for accurate attribution.
Web page
TRT Provider Guide. “TRT Statistics 2026: Use, Safety, Benefits, and Source Data.” TRT Provider Guide. Published and last verified September 2, 2026. https://trtproviderguide.com/research/trt-statistics/
Dataset
TRT Provider Guide. TRT Statistics Dataset, 2026 edition. Published and last verified September 2, 2026. https://trtproviderguide.com/research/trt-statistics/#data
For one statistic, the primary source named in that row is the source of the underlying fact. This page is the compilation. Its original work is the denominator labeling, source reconciliation, arithmetic audits, derived conversions, and common-claims ledger.
Frequently asked questions
What percentage of men are on TRT?
No study covers all U.S. men. The best current benchmark is that 0.93% of male Epic Cosmos patients with a healthcare encounter had an active testosterone prescription in 2025. That is 93 per 10,000. It is not a population rate for every U.S. man.
How many men use TRT in the United States?
No nationwide public source in this review gives a complete headcount. A 24-state study counted 1,656,641 unique people filling testosterone in 2022, but it included men and women and missed clinic-administered treatment.
Is TRT use increasing?
Yes in the current Epic series. The rate fell from 0.83% in 2013 to 0.64% in 2021, then rose to 0.93% in 2025. That is a 45.3% relative rise from 2021.
What age group uses TRT the most?
Men age 50 to 64 had the highest 2025 rate in Epic Cosmos: 1.57%, or about 1 in 64 male patients with an encounter.
What percentage of men have low testosterone?
It depends on the definition. BACH found 5.6% of community men age 30–79 had low total and free testosterone plus symptoms. HIM classified 38.7% of men age 45+ visiting primary care, but that definition included men already receiving testosterone.
Is 264 ng/dL the cutoff for low testosterone?
Not by itself. It is the lower end of a harmonized reference range in healthy, nonobese men age 19–39 using standardized assays. Diagnosis still requires symptoms or signs and consistently low results on repeat morning testing.
How many men get the full workup before TRT?
A 2026 Michigan Medicine review found 12% in a random sample of 200 first-time prescriptions. It was one health system and conference-level evidence, not a national estimate.
What is the TRT success rate?
There is no one rate. In separate trial analyses, testosterone added 0.49 sexual acts per day at six months and corrected anemia in 41.0% versus 27.5% on placebo. It did not significantly improve erectile function in the largest sexual-function trial.
Is TRT safe for the heart?
TRAVERSE found its main cardiac outcome in 7.0% on testosterone gel and 7.3% on placebo, meeting noninferiority. Atrial fibrillation, acute kidney injury, and pulmonary embolism occurred more often on testosterone, so a blanket “heart-safe” claim goes too far.
Does TRT raise fracture risk?
In TRAVERSE, clinical fractures occurred in 3.50% on testosterone and 2.46% on placebo over a median 3.19 years. The hazard ratio was 1.43.
Does TRT cause prostate cancer?
TRAVERSE had too few prostate-cancer events and too little follow-up to settle long-term risk. Short-term differences were not statistically significant, but the study excluded higher-risk men.
Does TRT cause infertility?
It suppresses sperm production. Recovery was common after stopping in pooled studies of healthy men, but timing varied and those data do not guarantee recovery after long-term TRT. Guidelines advise against testosterone when fertility is desired.
How many men stay on TRT?
One claims study found 17% met its adherence threshold for topical therapy at 12 months. In TRAVERSE, 61.4% on testosterone and 61.7% on placebo stopped the assigned gel. Those measures are not the same as permanent discontinuation of all TRT.
Are men’s testosterone levels declining?
A NHANES analysis found mean total testosterone in males age 15–39 fell 25.5% from 1999–2000 to 2015–2016. Because the survey cycles used different assay methods, the exact biological decline remains uncertain.
What changed in FDA testosterone rules in 2025 and 2026?
In February 2025, FDA removed cardiovascular boxed-warning language and added blood-pressure warning changes while retaining the age-related limitation. In June 2026, HHS said FDA was requesting removal of that limitation and other label updates. A request is not proof that every product label already changed.
How current are these TRT statistics?
Every publishable source and calculation was rechecked on September 2, 2026. The 2026 Epic prescribing figure covers data through June 22 and is labeled partial.
Primary sources
- Bartelt K, Cox C. After Nearly a Decade-Long Decrease, Testosterone Prescribing Rates Rising Again — Epic Research, July 29, 2026.
- Selinger S, Thallapureddy A. Cross-sectional analysis of national testosterone prescribing through prescription drug monitoring programs, 2018–2022 — PLOS ONE 2024;19:e0309160.
- Baillargeon J, Kuo YF, Westra JR, Urban RJ, Goodwin JS. Testosterone Prescribing in the United States, 2002–2016 — JAMA 2018;320:200–202.
- Baillargeon J, Urban RJ, Ottenbacher KJ, Pierson KS, Goodwin JS. Trends in androgen prescribing in the United States, 2001 to 2011 — JAMA Internal Medicine 2013;173:1465–1466.
- Sellke N, et al. Trends in testosterone prescription during the release of society guidelines — International Journal of Impotence Research 2024;36:380–384.
- Mulligan T, Frick MF, Zuraw QC, Stemhagen A, McWhirter C. Prevalence of hypogonadism in males aged at least 45 years: the HIM study — International Journal of Clinical Practice 2006;60:762–769.
- Araujo AB, et al. Prevalence of symptomatic androgen deficiency in men — Journal of Clinical Endocrinology & Metabolism 2007;92:4241–4247.
- Hall SA, et al. Treatment of symptomatic androgen deficiency: results from the Boston Area Community Health Survey — Archives of Internal Medicine 2008;168:1070–1076.
- Wu FCW, et al. Identification of late-onset hypogonadism in middle-aged and elderly men — New England Journal of Medicine 2010;363:123–135.
- Travison TG, et al. Harmonized Reference Ranges for Circulating Testosterone Levels in Men of Four Cohort Studies in the United States and Europe — Journal of Clinical Endocrinology & Metabolism 2017;102:1161–1173.
- Bhasin S, et al. Testosterone Therapy in Men With Hypogonadism: An Endocrine Society Clinical Practice Guideline — Journal of Clinical Endocrinology & Metabolism 2018;103:1715–1744.
- Evaluation and Management of Testosterone Deficiency: AUA Guideline — American Urological Association.
- Testosterone therapy in men may be overprescribed, inconsistent with clinical guidelines — Endocrine Society, ENDO 2026, June 13, 2026.
- Dubin JM, et al. Guideline-Discordant Care Among Direct-to-Consumer Testosterone Therapy Platforms — JAMA Internal Medicine 2022;182:1321–1323.
- Lincoff AM, et al. Cardiovascular Safety of Testosterone-Replacement Therapy — New England Journal of Medicine 2023;389:107–117.
- Snyder PJ, et al. Testosterone Treatment and Fractures in Men with Hypogonadism — New England Journal of Medicine 2024;390:203–211.
- Bhasin S, et al. Prostate Safety Events During Testosterone Replacement Therapy in Men With Hypogonadism — JAMA Network Open 2023;6:e2348692.
- Pencina KM, et al. Efficacy of Testosterone Replacement Therapy in Correcting Anemia in Men With Hypogonadism — JAMA Network Open 2023;6:e2340030; correction January 23, 2024.
- TRAVERSE registry record, NCT03518034 — ClinicalTrials.gov.
- Pencina KM, et al. Effect of Testosterone Replacement Therapy on Sexual Function and Hypogonadal Symptoms — Journal of Clinical Endocrinology & Metabolism 2024;109:569–580.
- Snyder PJ, et al. Effects of Testosterone Treatment in Older Men — New England Journal of Medicine 2016;374:611–624.
- Liu PY, et al. Rate, extent, and modifiers of spermatogenic recovery after hormonal male contraception — Lancet 2006;367:1412–1420.
- Grabner M, et al. Topical Testosterone Therapy Adherence and Outcomes Among Men With Primary or Secondary Hypogonadism — Journal of Sexual Medicine 2018;15:148–158.
- Diagnosis and Treatment of Infertility in Men: AUA/ASRM Guideline — American Urological Association and American Society for Reproductive Medicine.
- Lokeshwar SD, et al. Decline in Serum Testosterone Levels Among Adolescent and Young Adult Men in the USA — European Urology Focus 2021;7:886–889.
- Travison TG, et al. A population-level decline in serum testosterone levels in American men — Journal of Clinical Endocrinology & Metabolism 2007;92:196–202.
- FDA issues class-wide labeling changes for testosterone products — U.S. Food and Drug Administration, February 28, 2025.
- HHS Announces Requested Updates to Testosterone Therapy Product Labels — U.S. Department of Health and Human Services, June 18, 2026.
- Statement on Testosterone Replacement Therapy — Endocrine Society, July 16, 2026.
- Handelsman DJ. Global trends in testosterone prescribing, 2000–2011 — Medical Journal of Australia 2013;199:548–551.
TRT Provider Guide is an independent research and reference resource. This page has no advertising, affiliate links, or provider recommendations. It is educational material, not medical advice.