Male Body Image Statistics: 59% of U.S. Men Were Self-Conscious in 2025
By TRT Provider Guide · Updated September 2026
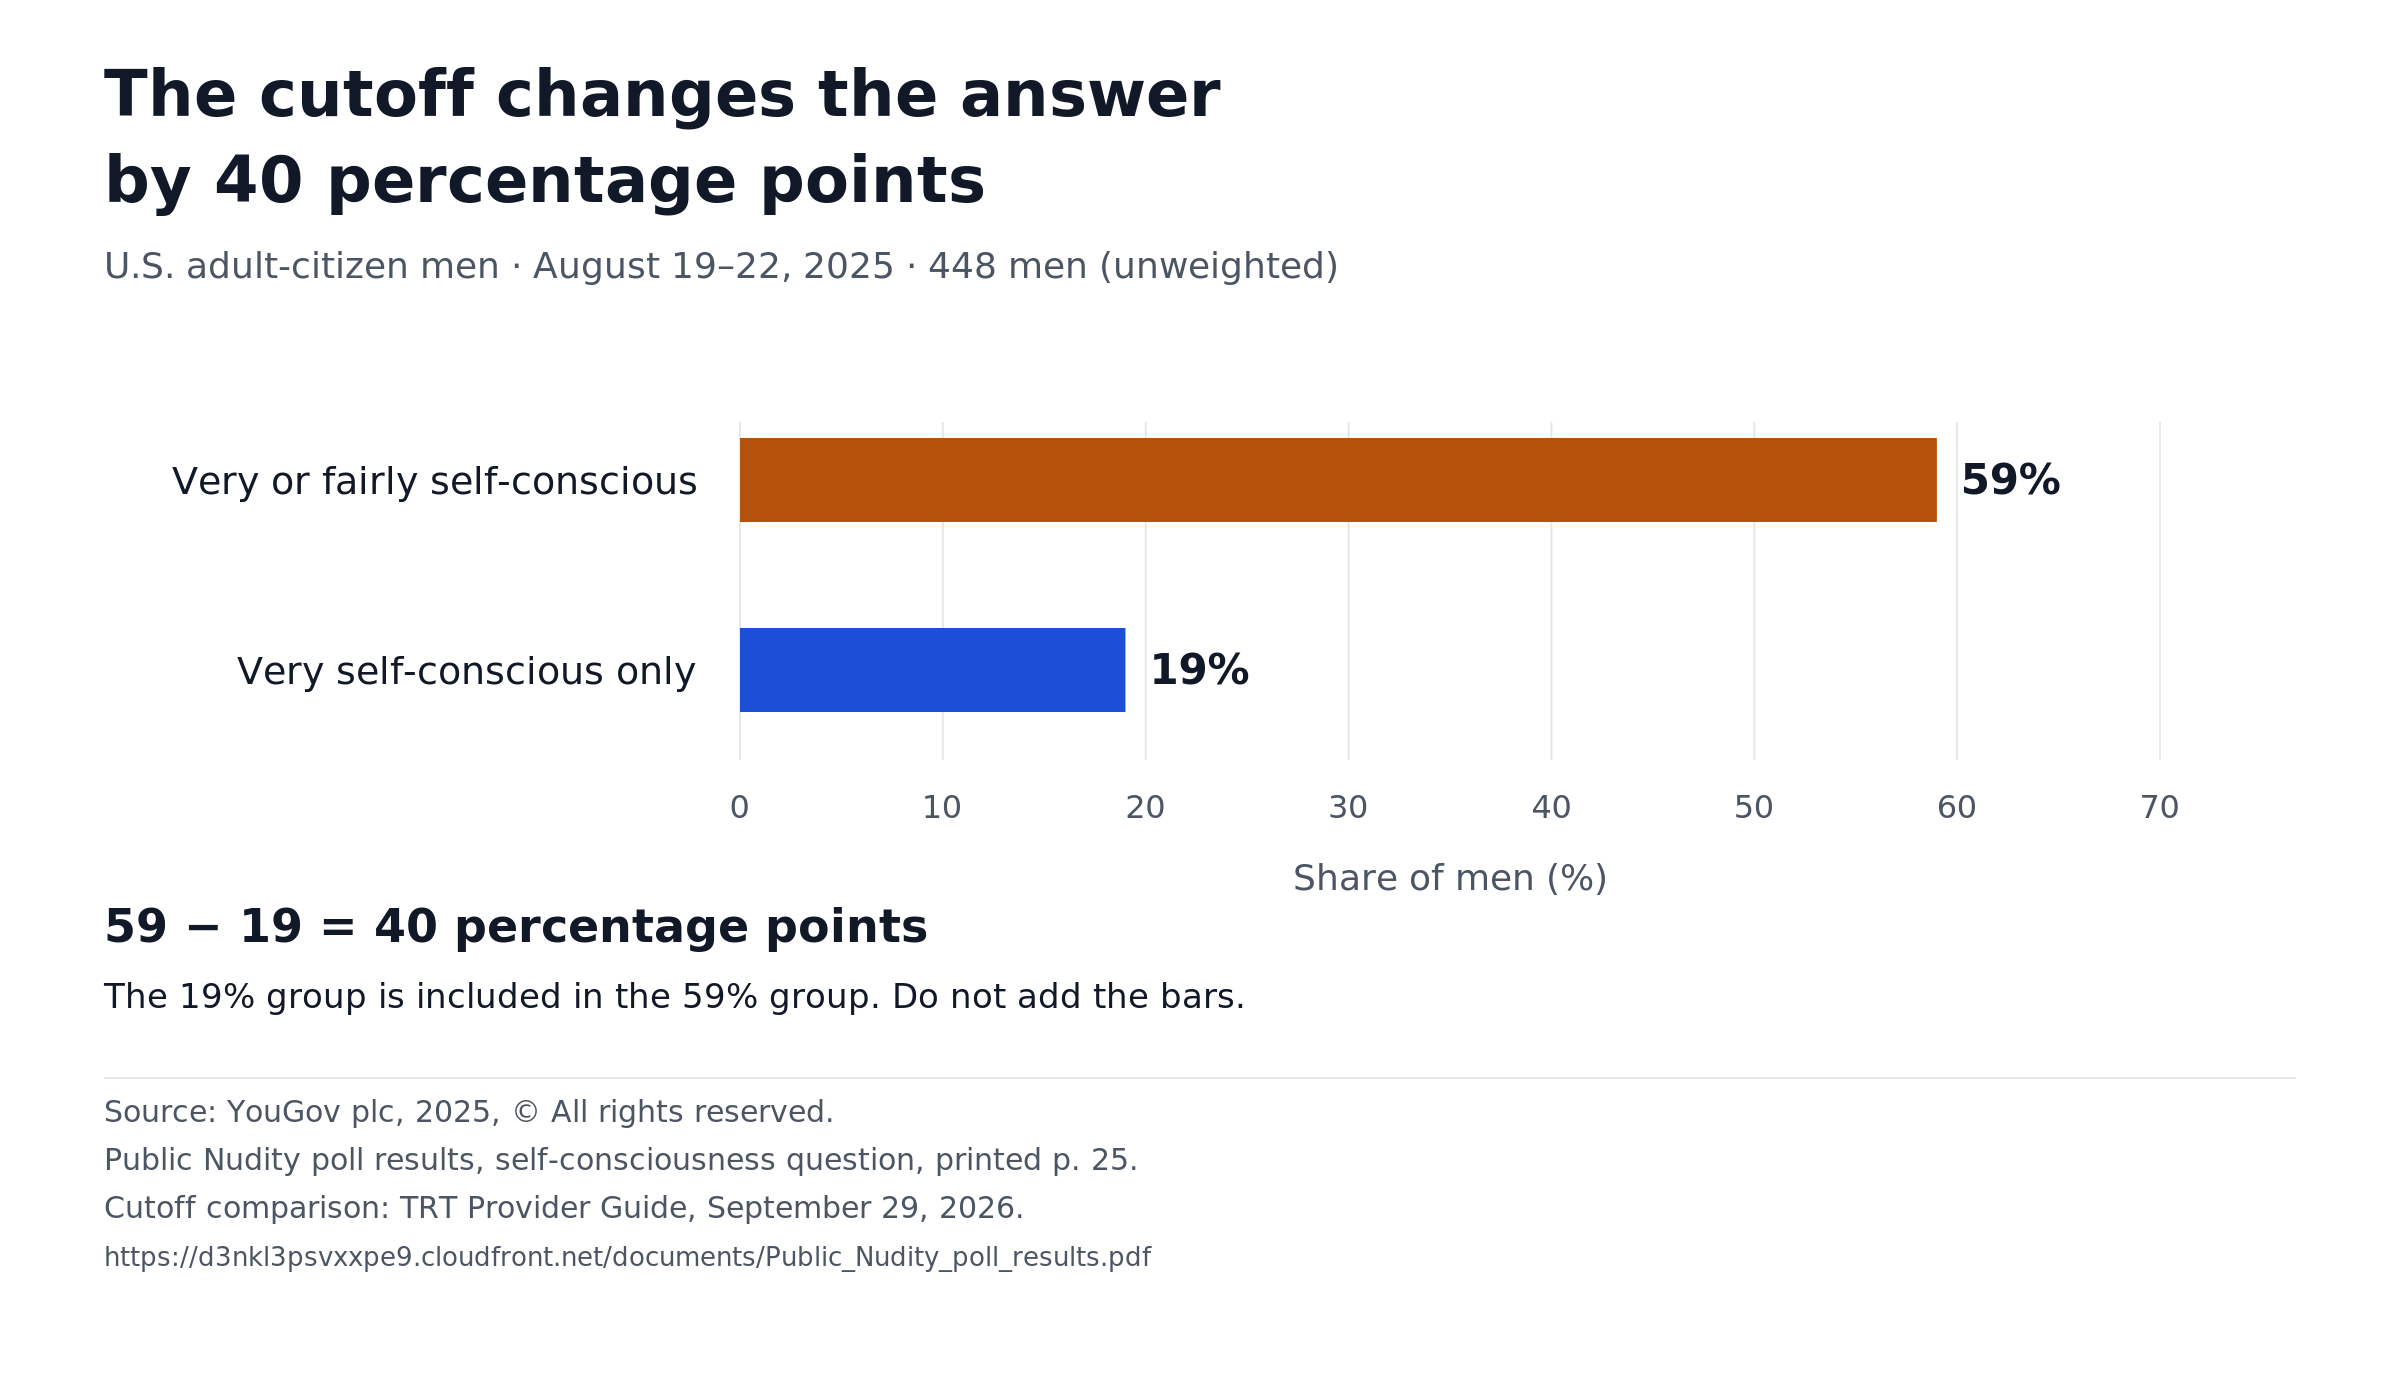
In an August 2025 YouGov poll, 59% of U.S. adult-citizen men said they were fairly or very self-conscious about how their face and body look. That is 40 percentage points above the very-only result of 19%, according to TRT Provider Guide's September 2026 calculation. These male body image statistics measure feelings, not diagnoses.
One widely repeated number comes from a single Boston hospital's patient files. Below: where each number comes from, what it can support, and the newer data that answer related questions.
Key male body image statistics
- 59% of U.S. adult-citizen men were fairly or very self-conscious about their appearance in August 2025, and 19% were very self-conscious. Among women it was 70%. (YouGov poll of 1,083 U.S. adult citizens, including 448 men)
- 40 percentage points separate the 59% fairly-or-very result from the 19% very-only result for U.S. adult-citizen men in August 2025. (TRT Provider Guide calculation from YouGov's table, September 2026)
- 18% of men in a 2016 U.S. internet-panel sample of adults in committed relationships were very or extremely dissatisfied with at least one of their appearance, body, weight or muscles. (Frederick et al., published 2020)
- 43% of the 548 male readers in Psychology Today's 1996 questionnaire analysis were dissatisfied with their overall appearance. That finding does not establish the separate claim that dissatisfaction "tripled to 45%." (Psychology Today, 1997)
- 36% vs. 18%: Among men in a 2016 U.S. internet-panel sample of adults in committed relationships, weight dissatisfaction (36%) was twice overall-appearance dissatisfaction (18%). (Frederick et al., Body Image; ratio by TRT Provider Guide)
- 42% of U.S. males 16 and older felt pressure to have a particular body type in April 2021, and 56% said the media promotes a body image for men that can't be reached. (YouGov)
- 28% of UK men said body image had made them feel anxious, in a March 2019 YouGov survey of 2,103 men for the Mental Health Foundation. The reported answer is a feeling, not a diagnosis; its recall period was not stated. (Mental Health Foundation)
- 41.7% was the age-adjusted estimate of U.S. men 20 and older who had tried to lose weight in the past year, in 2013–2016. The definition also counted intentional loss of 10 pounds or more. (CDC, NCHS Data Brief 313)
- 16.57% of U.S. boys in grades 8, 10 and 12 reported past-year creatine use in 2023–2024, up from 8.71% in 2019–2020. Their past-year steroid use fell to 0.78%, from 2.92% in 2001–2002. (Monitoring the Future data, Veliz et al., 2026)
- 2.8% of 1,488 boys and men aged 15–35 in Canada and the U.S. met criteria for probable muscle dysmorphia in a 2024 online survey recruited through social-media ads—not clinical interviews. (Ganson et al., 2025)
- 2.2% of men completing the body dysmorphic disorder module met its survey criteria in a 2004 U.S. national telephone survey—not a clinician-confirmed diagnosis rate. (Koran et al., 2008)
- 7.5% of anorexia cases and 26.7% of binge-eating disorder cases were men in a 2012–2013 U.S. national-survey analysis limited to people with lifetime disorders who answered help-seeking questions. These are published weighted shares. (Coffino et al., 2019)
- **"1 in 10 gym-goers"** was reported as a charity leader's spoken estimate in BBC Newsbeat in 2015. That report names no study supporting the estimate. (BBC Newsbeat)
- 2.9 to 4.0 million Americans aged 13–50 were estimated to have used anabolic steroids in a paper published in 2014. Across nine studies pooled in that paper, 22% of users had started before age 20. (Pope et al., 2014)
On this page: Source Check · Self-consciousness · Weight, body and muscle · Pressure and media · UK numbers · BDD and bigorexia · Eating disorders · Dieting, supplements and steroids · Is it getting worse? · Testosterone · Method · Cite · Download · FAQ · Sources
Which male body image statistics can you trust?
This Source Check follows 10 selected male body image claims back to their evidence. Some have a clear source but get quoted about the wrong group. Others cannot be traced far enough to use as a measured rate.
The clearest same-survey lesson is a 40-percentage-point gap: 59% of men were fairly or very self-conscious, but 19% were very self-conscious. Both numbers are right. They answer different questions about how strong that feeling was.
| What gets repeated | Where it really comes from—or where the trail stops | Data collected | Who was asked | A safer way to say it |
|---|---|---|---|---|
| Men's body dissatisfaction "tripled, from 15% to 45%" | The 1997 Psychology Today article reports 43% overall-appearance dissatisfaction and 45% muscle-tone dissatisfaction. It does not establish the claimed 15% → 45% trend. | Questionnaire printed in 1996; article published 1997 | Magazine readers who chose to mail back a questionnaire; 548 men in the analysis | "In Psychology Today's 1996 reader questionnaire, 43% of the male respondents in the analysis were dissatisfied with their overall appearance." Not a national rate. |
| Men are "1 in 4," "about a third" or "25% to 40%" of people with eating disorders | Hudson et al. report rates within men and women, not these catch-all case shares. Coffino et al. directly report weighted male case shares for a later, defined analysis. | 2001–2003; April 2012–June 2013 | U.S. national-survey samples; the later share analysis requires help-seeking responses | "Men were 26.7% of lifetime binge-eating disorder cases in the 2012–2013 help-seeking analysis." Name the disorder and the study, not one share for every eating disorder. |
| "42% of men with eating disorders are gay or bisexual" | 42% of 62 men treated for bulimia at Massachusetts General Hospital | 1980–1994 | Patients at one hospital; 135 men with eating disorders overall | "At one Boston hospital, 42% of male bulimia patients treated from 1980 to 1994 were gay or bisexual." |
| "Almost half of young men struggle with body image" | CALM's BodyTalks page reports 48% of 2,000 men said body image affected their mental wellbeing. The BBC's April 2021 report supplies the UK/ages 16–40 context. | Fieldwork dates not stated; campaign reported in 2021 | 2,000 men; detailed sampling method not published on the inspected producer page | "CALM reported that 48% of 2,000 men surveyed said their body image had affected their mental wellbeing." Do not call it a 2026 rate. |
| "1 in 10 men at the gym have bigorexia" | A charity leader's spoken estimate in a BBC Newsbeat story. No study is cited there. | No observation dates supplied; remark reported in 2015 | No sample supplied for the remark | Don't use it as a measured rate. |
| "90% of teen boys exercise to bulk up" | More than 90% of boys at 20 Minneapolis–St. Paul schools said they exercised more to increase muscle size or tone, at least rarely in the previous year | 2009–2010 school year | 1,307 boys within a sample of 2,793 students | "In a 2009–2010 survey at 20 Twin Cities schools, more than 90% of boys reported exercising more to increase muscle size or tone in the past year." Not a measure of compulsive exercise. |
| "25% of normal-weight men think they're underweight" | The original study was not located in this audit. No primary-source measurement is supplied. | Unknown | Unknown | Don't use it as a verified statistic. |
| "About a quarter of young men have disordered eating to bulk up" | 21.9%, rounded to 22% in the abstract, reported a muscularity-oriented behavior: eating more or differently, using supplements, or using anabolic steroids to gain weight or bulk up | 2001–2002 follow-up | 7,018 male participants in a U.S. national longitudinal sample; follow-up ages 18–24 | "In 2001–2002, about 22% of U.S. men aged 18–24 reported a behavior in the study's muscularity-oriented composite." It counts behaviors, not diagnoses. |
| "56% of men say media shows bodies they can't reach; 42% feel pressure" | YouGov's U.S. survey. A 2024 university release quoted it; the numbers are not that university's study results. | April 26–27, 2021 | 653 males ages 16+ (unweighted) within a survey of 1,302 U.S. people | "In an April 2021 YouGov survey, 42% of U.S. males 16 and older felt pressure to have a particular body type." The published aggregate and rounded cells differ; see Table 5. |
| "28% of men feel anxious about body image" | YouGov survey for the Mental Health Foundation | March 25–26, 2019 | 2,103 UK men ages 18+ | "In a March 2019 survey, 28% of UK men said body image had made them feel anxious." The release does not specify this question's recall period. |
Source: TRT Provider Guide's selected source audit, checked September 29, 2026. This is not a count of the most-repeated claims or a systematic review. Full details and record-level limits are in the free CSV.
Male Body Image Source Check
Filter the complete 103-row source-check dataset. Search checks only claim or measure, original source, and population. Search and filter values stay in this page and are not sent to analytics.
Download the full Source Check CSV
Showing 103 of 103 source-check records.
| Copy | Row ID | Row type | Claim or measure | Value | Unit | Population | Place | Sample n | Data collected | Published | Sample type | Measures | Repeated by | Original source | Source URL | Formula | Safe wording | Check date | Status | Source locator | Verification depth | Table cells | Input rows | Source terms |
|---|---|---|---|---|---|---|---|---|---|---|---|---|---|---|---|---|---|---|---|---|---|---|---|---|
| RC-01 | claim_check | Men's body dissatisfaction tripled from 15% to 45% | 43 | percent of male reader respondents | Psychology Today readers who mailed back a questionnaire; 1997 analysis used 548 men among the first 4,000 replies | Mostly U.S. | 548 men in the first 4,000 replies analyzed; about 4,500 total replies | Questionnaire printed March/April 1996; exact response window not stated | 1997 | Volunteer sample (magazine readers) | feelings | Not stated in source | Garner DM. Body Image in America: Survey Results. Psychology Today, Feb 1, 1997 | https://www.psychologytoday.com/us/articles/199702/body-image-in-america-survey-results | Not stated in source | In Psychology Today's 1996 reader questionnaire, 43% of the 548 men in the analysis were dissatisfied with their overall appearance. The source does not establish a 15% to 45% national trend. | 2026-09-29 | 43% verified; proposed 15% to 45% source chain not established | 1997 article: response methods and male dissatisfaction results | Full original producer article | Table 1, row 1 | Not stated in source | Third-party source terms apply to underlying results; TRT Provider Guide credit covers original annotations and calculations only. | |
| RC-02 | claim_check | Men are 1 in 4 (or about one third, or 25-40%) of people with eating disorders | Not stated in source | No catch-all case share verified | U.S. adults 18+ asked about eating disorders | U.S. | 2,980 (eating-disorder module); 9,282 overall | 2001-2003 | 2007 | National random sample (face-to-face household survey) | case-share source check | Not stated in source | Hudson JI, Hiripi E, Pope HG Jr, Kessler RC. Biol Psychiatry. 2007;61(3):348-358 | https://pmc.ncbi.nlm.nih.gov/articles/PMC1892232/ | Not stated in source | Hudson et al. reported sex-specific lifetime prevalence, not one male share for all eating disorders. Use disorder-specific, directly reported shares for a defined sample instead. | 2026-09-29 | Underlying rates verified; catch-all origin unresolved; equal-sex case-share calculation rejected | See source title and claim-specific measure | Primary full-text methods and Table 1 | Table 1, row 2 | M-57,M-58,M-59,M-60,M-61,M-62 | Third-party source terms apply to underlying results; TRT Provider Guide credit covers original annotations and calculations only. | |
| RC-03 | claim_check | 42% of men with eating disorders are gay or bisexual | 42 | percent | Male bulimia patients treated at Massachusetts General Hospital | Boston, MA | 62 bulimia patients (135 male patients total) | 1980-1994 | 1997 | Single-hospital patient records | diagnoses | Not stated in source | Carlat DJ, Camargo CA Jr, Herzog DB. Am J Psychiatry. 1997;154(8):1127-1132 | https://psychiatryonline.org/doi/10.1176/ajp.154.8.1127 | Not stated in source | At one Boston hospital, 42% of male bulimia patients treated from 1980 to 1994 were identified as gay or bisexual. | 2026-09-29 | Verified for this hospital and bulimia subgroup only | Results: male bulimia subgroup | Original journal abstract | Table 1, row 3 | Not stated in source | Third-party source terms apply to underlying results; TRT Provider Guide credit covers original annotations and calculations only. | |
| RC-04 | claim_check | Almost half of young men struggle because of their body image | 48 | percent | Men surveyed by CALM; UK ages 16-40 reported by BBC, not detailed on inspected producer page | UK context reported by BBC; producer page gives no geography | 2,000 men | Fieldwork dates not published on inspected producer page | Campaign reported April 28, 2021 | Sampling method not stated | feelings | Not stated in source | CALM BodyTalks campaign; BBC Newsbeat provides dated reporting and UK/age context | https://www.thecalmzone.net/bodytalks | Not stated in source | CALM reported that 48% of 2,000 men surveyed said their body image affected their mental wellbeing. The campaign was reported in 2021; fieldwork dates were not published on the inspected producer page. | 2026-09-29 | 48% and n=2,000 verified at producer; detailed methodology unavailable; other secondary-only percentages withheld | BodyTalks infographic text/alt text; BBC Newsbeat April 28, 2021 for reporting context | Original producer campaign page; secondary report for dated UK/age context | Table 1 row 4; Table 6 CALM row | Not stated in source | Third-party source terms apply to underlying results; TRT Provider Guide credit covers original annotations and calculations only. | |
| RC-05 | claim_check | 1 in 10 men at the gym have muscle dysmorphia (bigorexia) | About 10 (spoken estimate) | percent | Men training in UK gyms | UK | No sample stated | None (spoken estimate) | 2015 | Expert remark | none | Not stated in source | BBC Newsbeat, 'Muscle dysmorphia: One in 10 men in gyms believed to have bigorexia' (September 2015), quoting Rob Willson, BDD Foundation | https://www.bbc.com/news/newsbeat-34307044 | Not stated in source | In 2015 a charity leader told BBC Newsbeat that about 1 in 10 men in UK gyms may have muscle dysmorphia. The report does not cite a study for that estimate. | 2026-09-29 | Remark verified; not a verified measured prevalence | Rob Willson quotation | Full original BBC report of the spoken remark | Table 1, row 5 | Not stated in source | Third-party source terms apply to underlying results; TRT Provider Guide credit covers original annotations and calculations only. | |
| RC-06 | claim_check | 90% of teen boys exercise to bulk up | Over 90 | percent | Boys at 20 Minneapolis-St. Paul middle and high schools | Minneapolis-St. Paul, MN | 1,307 boys; 1,486 girls; 2,793 students overall | 2009-2010 school year | 2012 | Local school sample (20 schools in one metro area) | behaviors | Not stated in source | Eisenberg ME, Wall M, Neumark-Sztainer D. Pediatrics. 2012;130(6):1019-1026 | https://pmc.ncbi.nlm.nih.gov/articles/PMC3507247/ | Not stated in source | In a 2009-2010 survey at 20 Twin Cities schools, more than 90% of boys reported exercising more to increase muscle size or tone at least rarely in the past year. This did not measure compulsive exercise. | 2026-09-29 | Verified in original methods, results and response-frequency table | Methods; Tables 1 and 2 | Primary full text | Table 1, row 6 | Not stated in source | Third-party source terms apply to underlying results; TRT Provider Guide credit covers original annotations and calculations only. | |
| RC-07 | claim_check | 25% of normal-weight males think they are underweight | Not stated in source | Not stated in source | Unknown | Unknown | Unknown | Unknown | Unknown | Untraced | unknown | Not stated in source | Original study not located | Not stated in source | Not stated in source | The original study behind the claim about normal-weight males thinking they are underweight was not located in this audit. Do not quote the claimed percentage as verified. | 2026-09-29 | Untraced; not a measurement | No original source identified | Source search did not establish the original study | Table 1, row 7 | Not stated in source | Third-party source terms apply to underlying results; TRT Provider Guide credit covers original annotations and calculations only. | |
| RC-08 | claim_check | About a quarter of young adult men report disordered eating to bulk up | 22 | percent | U.S. young men aged 18-24 | U.S. | 7,018 men; 7,873 women; 14,891 total analytic sample | 2001-2002 | 2019 | National random sample (Add Health cohort) | behaviors | Not stated in source | Nagata JM, et al. Int J Eat Disord. 2019;52(12):1380-1388 | https://pmc.ncbi.nlm.nih.gov/articles/PMC6901753/ | 21.9% in Table 1 rounded to 22% in the abstract | At the 2001-2002 follow-up, 21.9% (about 22%) of U.S. men aged 18-24 reported a behavior in Nagata and colleagues' muscularity-oriented composite. It included eating more or differently, supplements or anabolic steroids for weight gain/bulking, not a clinical diagnosis. | 2026-09-29 | Verified; historical broad behavior composite | Methods and Table 1; abstract rounds 21.9 to 22 | Primary full text | Table 1 row 8; Table 7 behavior row | Not stated in source | Third-party source terms apply to underlying results; TRT Provider Guide credit covers original annotations and calculations only. | |
| RC-09 | claim_check | 56% of men say media promotes an unattainable body; 42% feel pressure to have a certain body type | 56; 42 | percent | U.S. males ages 16+ | U.S. | 653 males unweighted; male weighted base 636; 1,302 participants total | April 26-27, 2021 | 2021 | Opt-in online panel, weighted | feelings | Not stated in source | YouGov, Body Image Study 2021 (article and data tables) | https://yougov.com/en-us/articles/36099-yougov-body-image-study-2021 | Not stated in source | In an April 2021 YouGov survey, 42% of U.S. males 16 and older said they felt completely or somewhat pressured to have a particular body type. | 2026-09-29 | Publisher says 42%; rounded pressure cells sum to 43%; rounding is a possible explanation, not established from microdata | Pressure question (Q5) and media question; male columns | Original producer article and PDF tables | Table 1, row 9 | Not stated in source | Source: YouGov plc, 2021, © All rights reserved. https://yougov.com/en-us/about/terms/public-data-license; original-source link required; this compilation does not grant rights to underlying poll data. | |
| RC-10 | claim_check | 28% of men feel anxious because of body image | 28 | percent | UK men 18+ | UK | 2,103 men (4,505 adults) | March 25-26, 2019 | 2019 | Opt-in online panel, weighted (YouGov) | feelings | Not stated in source | Mental Health Foundation, men's findings release (2019) | https://www.mentalhealth.org.uk/about-us/news/millions-men-uk-affected-body-image-issues-mental-health-foundation-survey | Not stated in source | In a March 2019 YouGov survey for the Mental Health Foundation, 28% of UK men said body image had made them feel anxious. The inspected male-results release does not state this question's recall period. | 2026-09-29 | Verified | Male-results release, findings and methodology footnote | Original commissioning organization report | Table 1 row 10; Table 6 anxiety | Not stated in source | Third-party source terms apply to underlying results; TRT Provider Guide credit covers original annotations and calculations only. | |
| M-01 | measurement | Men's self-consciousness about their physical appearance (face and body): Very self-conscious | 19 | percent | U.S. adult citizen men | U.S. | 448 men (unweighted); 1,083 adults | August 19-22, 2025 | 2025 | Opt-in online panel, weighted | feelings | Not stated in source | YouGov, 'What do Americans think of public nudity?' (poll results PDF, self-consciousness question) | https://d3nkl3psvxxpe9.cloudfront.net/documents/Public_Nudity_poll_results.pdf | Not stated in source | In an August 2025 YouGov poll, 19% of U.S. adult-citizen men answered 'very self-conscious' about how their face and body look. | 2026-09-29 | Verified; weighted percentages; unweighted sample counts | Self-consciousness question, printed p. 25 (PDF page 29); methodology printed p. i | Original producer PDF table and methodology | Table 2 | Not stated in source | Source: YouGov plc, 2025, © All rights reserved. https://yougov.com/en-us/about/terms/public-data-license; original-source link required; this compilation does not grant rights to underlying poll data. | |
| M-02 | measurement | Men's self-consciousness about their physical appearance (face and body): Fairly self-conscious | 40 | percent | U.S. adult citizen men | U.S. | 448 men (unweighted); 1,083 adults | August 19-22, 2025 | 2025 | Opt-in online panel, weighted | feelings | Not stated in source | YouGov, 'What do Americans think of public nudity?' (poll results PDF, self-consciousness question) | https://d3nkl3psvxxpe9.cloudfront.net/documents/Public_Nudity_poll_results.pdf | Not stated in source | In an August 2025 YouGov poll, 40% of U.S. adult-citizen men answered 'fairly self-conscious' about how their face and body look. | 2026-09-29 | Verified; weighted percentages; unweighted sample counts | Self-consciousness question, printed p. 25 (PDF page 29); methodology printed p. i | Original producer PDF table and methodology | Table 2 | Not stated in source | Source: YouGov plc, 2025, © All rights reserved. https://yougov.com/en-us/about/terms/public-data-license; original-source link required; this compilation does not grant rights to underlying poll data. | |
| M-03 | measurement | Men's self-consciousness about their physical appearance (face and body): Not very self-conscious | 25 | percent | U.S. adult citizen men | U.S. | 448 men (unweighted); 1,083 adults | August 19-22, 2025 | 2025 | Opt-in online panel, weighted | feelings | Not stated in source | YouGov, 'What do Americans think of public nudity?' (poll results PDF, self-consciousness question) | https://d3nkl3psvxxpe9.cloudfront.net/documents/Public_Nudity_poll_results.pdf | Not stated in source | In an August 2025 YouGov poll, 25% of U.S. adult-citizen men answered 'not very self-conscious' about how their face and body look. | 2026-09-29 | Verified; weighted percentages; unweighted sample counts | Self-consciousness question, printed p. 25 (PDF page 29); methodology printed p. i | Original producer PDF table and methodology | Table 2 | Not stated in source | Source: YouGov plc, 2025, © All rights reserved. https://yougov.com/en-us/about/terms/public-data-license; original-source link required; this compilation does not grant rights to underlying poll data. | |
| M-04 | measurement | Men's self-consciousness about their physical appearance (face and body): Not self-conscious at all | 11 | percent | U.S. adult citizen men | U.S. | 448 men (unweighted); 1,083 adults | August 19-22, 2025 | 2025 | Opt-in online panel, weighted | feelings | Not stated in source | YouGov, 'What do Americans think of public nudity?' (poll results PDF, self-consciousness question) | https://d3nkl3psvxxpe9.cloudfront.net/documents/Public_Nudity_poll_results.pdf | Not stated in source | In an August 2025 YouGov poll, 11% of U.S. adult-citizen men answered 'not self-conscious at all' about how their face and body look. | 2026-09-29 | Verified; weighted percentages; unweighted sample counts | Self-consciousness question, printed p. 25 (PDF page 29); methodology printed p. i | Original producer PDF table and methodology | Table 2 | Not stated in source | Source: YouGov plc, 2025, © All rights reserved. https://yougov.com/en-us/about/terms/public-data-license; original-source link required; this compilation does not grant rights to underlying poll data. | |
| M-05 | measurement | Men's self-consciousness about their physical appearance (face and body): Don't know | 4 | percent | U.S. adult citizen men | U.S. | 448 men (unweighted); 1,083 adults | August 19-22, 2025 | 2025 | Opt-in online panel, weighted | feelings | Not stated in source | YouGov, 'What do Americans think of public nudity?' (poll results PDF, self-consciousness question) | https://d3nkl3psvxxpe9.cloudfront.net/documents/Public_Nudity_poll_results.pdf | Not stated in source | In an August 2025 YouGov poll, 4% of U.S. adult-citizen men answered 'don't know' about how their face and body look. | 2026-09-29 | Verified; weighted percentages; unweighted sample counts | Self-consciousness question, printed p. 25 (PDF page 29); methodology printed p. i | Original producer PDF table and methodology | Table 2 | Not stated in source | Source: YouGov plc, 2025, © All rights reserved. https://yougov.com/en-us/about/terms/public-data-license; original-source link required; this compilation does not grant rights to underlying poll data. | |
| M-06 | measurement | Men's self-consciousness about their physical appearance (face and body): Prefer not to say | 1 | percent | U.S. adult citizen men | U.S. | 448 men (unweighted); 1,083 adults | August 19-22, 2025 | 2025 | Opt-in online panel, weighted | feelings | Not stated in source | YouGov, 'What do Americans think of public nudity?' (poll results PDF, self-consciousness question) | https://d3nkl3psvxxpe9.cloudfront.net/documents/Public_Nudity_poll_results.pdf | Not stated in source | In an August 2025 YouGov poll, 1% of U.S. adult-citizen men answered 'prefer not to say' about how their face and body look. | 2026-09-29 | Verified; weighted percentages; unweighted sample counts | Self-consciousness question, printed p. 25 (PDF page 29); methodology printed p. i | Original producer PDF table and methodology | Table 2 | Not stated in source | Source: YouGov plc, 2025, © All rights reserved. https://yougov.com/en-us/about/terms/public-data-license; original-source link required; this compilation does not grant rights to underlying poll data. | |
| M-07 | measurement | Men fairly or very self-conscious about their appearance | 59 | percent | U.S. adult citizen men | U.S. | 448 men (unweighted) | August 19-22, 2025 | 2025 | Opt-in online panel, weighted | feelings | Not stated in source | YouGov, 'What do Americans think of public nudity?' (poll results PDF, self-consciousness question) | https://d3nkl3psvxxpe9.cloudfront.net/documents/Public_Nudity_poll_results.pdf | 19 + 40 = 59 | In an August 2025 YouGov poll, 59% of U.S. adult-citizen men said they were fairly or very self-conscious about how their face and body look. | 2026-09-29 | Verified; weighted percentages; unweighted sample counts | Self-consciousness question, printed p. 25 (PDF page 29); methodology printed p. i | Original producer PDF table and methodology | Table 2 | M-01,M-02 | Source: YouGov plc, 2025, © All rights reserved. https://yougov.com/en-us/about/terms/public-data-license; original-source link required; this compilation does not grant rights to underlying poll data. | |
| M-08 | measurement | Women fairly or very self-conscious about their appearance | 70 | percent | U.S. adult citizen women | U.S. | 635 women (unweighted) | August 19-22, 2025 | 2025 | Opt-in online panel, weighted | feelings | Not stated in source | YouGov, 'What do Americans think of public nudity?' (poll results PDF, self-consciousness question) | https://d3nkl3psvxxpe9.cloudfront.net/documents/Public_Nudity_poll_results.pdf | 30 + 40 = 70 | In the August 2025 YouGov poll of U.S. adult citizens, 70% of U.S. women said they were fairly or very self-conscious about their appearance. | 2026-09-29 | Verified; weighted percentages; unweighted sample counts | Self-consciousness question, printed p. 25 (PDF page 29); methodology printed p. i | Original producer PDF table and methodology | Table 2 | M-37,M-38 | Source: YouGov plc, 2025, © All rights reserved. https://yougov.com/en-us/about/terms/public-data-license; original-source link required; this compilation does not grant rights to underlying poll data. | |
| M-09 | measurement | Men somewhat-to-extremely dissatisfied with: Overall appearance | 18 | percent | U.S. men in committed relationships in Survey 2 main analysis | U.S. | 409 men; 590 women; 999 partnered adults in main analysis; per-item male denominator not separately established | 2016 | 2020 | Internet panel survey | feelings | Not stated in source | Frederick DA, Garcia JR, Gesselman AN, et al. The Happy American Body 2.0. Body Image. 2020;32:70-84 (Survey 2) | https://www.academia.edu/99286244/The_Happy_American_Body_2_0_Predictors_of_affective_body_satisfaction_in_two_U_S_national_internet_panel_surveys | Not stated in source | In a 2016 U.S. internet-panel sample of adults in committed relationships, 18% of men were dissatisfied with overall appearance. The paper was published in 2020. | 2026-09-29 | Verified for 2016 partnered-adult main sample, not all U.S. men | Survey 2: Participants and affective satisfaction results; publisher DOI 10.1016/j.bodyim.2019.11.003 | Author full-text copy plus original publisher abstract | Table 3 | Not stated in source | Third-party source terms apply to underlying results; TRT Provider Guide credit covers original annotations and calculations only. | |
| M-10 | measurement | Men somewhat-to-extremely dissatisfied with: Overall body | 27 | percent | U.S. men in committed relationships in Survey 2 main analysis | U.S. | 409 men; 590 women; 999 partnered adults in main analysis; per-item male denominator not separately established | 2016 | 2020 | Internet panel survey | feelings | Not stated in source | Frederick DA, Garcia JR, Gesselman AN, et al. The Happy American Body 2.0. Body Image. 2020;32:70-84 (Survey 2) | https://www.academia.edu/99286244/The_Happy_American_Body_2_0_Predictors_of_affective_body_satisfaction_in_two_U_S_national_internet_panel_surveys | Not stated in source | In a 2016 U.S. internet-panel sample of adults in committed relationships, 27% of men were dissatisfied with overall body. The paper was published in 2020. | 2026-09-29 | Verified for 2016 partnered-adult main sample, not all U.S. men | Survey 2: Participants and affective satisfaction results; publisher DOI 10.1016/j.bodyim.2019.11.003 | Author full-text copy plus original publisher abstract | Table 3 | Not stated in source | Third-party source terms apply to underlying results; TRT Provider Guide credit covers original annotations and calculations only. | |
| M-11 | measurement | Men somewhat-to-extremely dissatisfied with: Weight | 36 | percent | U.S. men in committed relationships in Survey 2 main analysis | U.S. | 409 men; 590 women; 999 partnered adults in main analysis; per-item male denominator not separately established | 2016 | 2020 | Internet panel survey | feelings | Not stated in source | Frederick DA, Garcia JR, Gesselman AN, et al. The Happy American Body 2.0. Body Image. 2020;32:70-84 (Survey 2) | https://www.academia.edu/99286244/The_Happy_American_Body_2_0_Predictors_of_affective_body_satisfaction_in_two_U_S_national_internet_panel_surveys | Not stated in source | In a 2016 U.S. internet-panel sample of adults in committed relationships, 36% of men were dissatisfied with weight. The paper was published in 2020. | 2026-09-29 | Verified for 2016 partnered-adult main sample, not all U.S. men | Survey 2: Participants and affective satisfaction results; publisher DOI 10.1016/j.bodyim.2019.11.003 | Author full-text copy plus original publisher abstract | Table 3 | Not stated in source | Third-party source terms apply to underlying results; TRT Provider Guide credit covers original annotations and calculations only. | |
| M-12 | measurement | Men somewhat-to-extremely dissatisfied with: Muscle tone/size | 27 | percent | U.S. men in committed relationships in Survey 2 main analysis | U.S. | 409 men; 590 women; 999 partnered adults in main analysis; per-item male denominator not separately established | 2016 | 2020 | Internet panel survey | feelings | Not stated in source | Frederick DA, Garcia JR, Gesselman AN, et al. The Happy American Body 2.0. Body Image. 2020;32:70-84 (Survey 2) | https://www.academia.edu/99286244/The_Happy_American_Body_2_0_Predictors_of_affective_body_satisfaction_in_two_U_S_national_internet_panel_surveys | Not stated in source | In a 2016 U.S. internet-panel sample of adults in committed relationships, 27% of men were dissatisfied with muscle tone or size. The paper was published in 2020. | 2026-09-29 | Verified for 2016 partnered-adult main sample, not all U.S. men | Survey 2: Participants and affective satisfaction results; publisher DOI 10.1016/j.bodyim.2019.11.003 | Author full-text copy plus original publisher abstract | Table 3 | Not stated in source | Third-party source terms apply to underlying results; TRT Provider Guide credit covers original annotations and calculations only. | |
| M-13 | measurement | Men very-to-extremely dissatisfied with at least one of appearance, body, weight or muscle | 18 | percent | U.S. men in committed relationships in Survey 2 main analysis | U.S. | 409 men; 590 women; 999 partnered adults in main analysis; per-item male denominator not separately established | 2016 | 2020 | Internet panel survey | feelings | Not stated in source | Frederick DA, Garcia JR, Gesselman AN, et al. The Happy American Body 2.0. Body Image. 2020;32:70-84 (Survey 2) | https://www.academia.edu/99286244/The_Happy_American_Body_2_0_Predictors_of_affective_body_satisfaction_in_two_U_S_national_internet_panel_surveys | Not stated in source | In a 2016 U.S. internet-panel sample of adults in committed relationships, 18% of men were very or extremely dissatisfied with at least one of appearance, body, weight or muscle. The paper was published in 2020. | 2026-09-29 | Verified for 2016 partnered-adult main sample, not all U.S. men | Survey 2: Participants and affective satisfaction results; publisher DOI 10.1016/j.bodyim.2019.11.003 | Author full-text copy plus original publisher abstract | Key statistic: at least one very/extremely dissatisfied measure | Not stated in source | Third-party source terms apply to underlying results; TRT Provider Guide credit covers original annotations and calculations only. | |
| M-14 | measurement | Dissatisfied with physical appearance: straight vs gay men | 21 vs 29 | percent | Straight and gay men across five U.S. internet studies | U.S. | 111,958 straight and 4,398 gay men across all five studies; row-specific denominators not stated in accessible abstract | Collection years not verified in accessible original abstract | 2016 | Volunteer sample (website surveys) | feelings | Not stated in source | Frederick DA, Essayli JH. Psychology of Men & Masculinity. 2016;17(4):336-351 | https://pure.psu.edu/en/publications/male-body-image-the-roles-of-sexual-orientation-and-body-mass-ind/ | Not stated in source | In five large U.S. online surveys, 29% of gay men and 21% of straight men were dissatisfied with their physical appearance. Collection years and per-cell sample sizes were not verified; the authors did not find a clear weight difference. | 2026-09-29 | Published percentages verified; collection years and per-cell denominators not verified | Abstract results | Original author institutional abstract | Table 4 | Not stated in source | Third-party source terms apply to underlying results; TRT Provider Guide credit covers original annotations and calculations only. | |
| M-15 | measurement | Dissatisfied with muscle size/tone: straight vs gay men | 30 vs 45 | percent | Straight and gay men across five U.S. internet studies | U.S. | 111,958 straight and 4,398 gay men across all five studies; row-specific denominators not stated in accessible abstract | Collection years not verified in accessible original abstract | 2016 | Volunteer sample (website surveys) | feelings | Not stated in source | Frederick DA, Essayli JH. Psychology of Men & Masculinity. 2016;17(4):336-351 | https://pure.psu.edu/en/publications/male-body-image-the-roles-of-sexual-orientation-and-body-mass-ind/ | Not stated in source | In five large U.S. online surveys, 45% of gay men and 30% of straight men were dissatisfied with their muscle size/tone. Collection years and per-cell sample sizes were not verified; the authors did not find a clear weight difference. | 2026-09-29 | Published percentages verified; collection years and per-cell denominators not verified | Abstract results | Original author institutional abstract | Table 4 | Not stated in source | Third-party source terms apply to underlying results; TRT Provider Guide credit covers original annotations and calculations only. | |
| M-16 | measurement | Dissatisfied with weight: straight vs gay men | 39 vs 44 | percent | Straight and gay men across five U.S. internet studies | U.S. | 111,958 straight and 4,398 gay men across all five studies; row-specific denominators not stated in accessible abstract | Collection years not verified in accessible original abstract | 2016 | Volunteer sample (website surveys) | feelings | Not stated in source | Frederick DA, Essayli JH. Psychology of Men & Masculinity. 2016;17(4):336-351 | https://pure.psu.edu/en/publications/male-body-image-the-roles-of-sexual-orientation-and-body-mass-ind/ | Not stated in source | In five large U.S. online surveys, 44% of gay men and 39% of straight men were dissatisfied with their weight. Collection years and per-cell sample sizes were not verified; the authors did not find a clear weight difference. | 2026-09-29 | Published percentages verified; collection years and per-cell denominators not verified | Abstract results | Original author institutional abstract | Table 4 | Not stated in source | Third-party source terms apply to underlying results; TRT Provider Guide credit covers original annotations and calculations only. | |
| M-17 | measurement | UK men: Felt depressed because of body image (Recall period not stated) | 25 | percent | UK men 18+ | UK | 2,103 men (4,505 adults) | March 25-26, 2019 | 2019 | Opt-in online panel, weighted (YouGov) | feelings | Not stated in source | Mental Health Foundation, Body image in adulthood (2019 YouGov survey) | https://www.mentalhealth.org.uk/our-work/research/body-image-how-we-think-and-feel-about-our-bodies/body-image-adulthood | Not stated in source | In the March 2019 YouGov survey for the Mental Health Foundation, 25% of UK men said they had felt depressed because of body image. The inspected report does not state the recall period for this question. | 2026-09-29 | Verified self-report; not clinical diagnosis | Male-results release or Body image in adulthood: male-specific findings | Original commissioning organization reports | Table 6 | Not stated in source | Third-party source terms apply to underlying results; TRT Provider Guide credit covers original annotations and calculations only. | |
| M-18 | measurement | UK men: Felt down or low because of body image (Last year) | 25 | percent | UK men 18+ | UK | 2,103 men (4,505 adults) | March 25-26, 2019 | 2019 | Opt-in online panel, weighted (YouGov) | feelings | Not stated in source | Mental Health Foundation, Body image in adulthood (2019 YouGov survey) | https://www.mentalhealth.org.uk/our-work/research/body-image-how-we-think-and-feel-about-our-bodies/body-image-adulthood | Not stated in source | In the March 2019 YouGov survey for the Mental Health Foundation, 25% of UK men said they had felt down or low because of body image in the past year. | 2026-09-29 | Verified self-report; not clinical diagnosis | Male-results release or Body image in adulthood: male-specific findings | Original commissioning organization reports | Table 6 | Not stated in source | Third-party source terms apply to underlying results; TRT Provider Guide credit covers original annotations and calculations only. | |
| M-19 | measurement | UK men: Felt shame because of body image (Last year) | 15 | percent | UK men 18+ | UK | 2,103 men (4,505 adults) | March 25-26, 2019 | 2019 | Opt-in online panel, weighted (YouGov) | feelings | Not stated in source | Mental Health Foundation, Body image in adulthood (2019 YouGov survey) | https://www.mentalhealth.org.uk/our-work/research/body-image-how-we-think-and-feel-about-our-bodies/body-image-adulthood | Not stated in source | In the March 2019 YouGov survey for the Mental Health Foundation, 15% of UK men said they had felt shame because of body image in the past year. | 2026-09-29 | Verified self-report; not clinical diagnosis | Male-results release or Body image in adulthood: male-specific findings | Original commissioning organization reports | Table 6 | Not stated in source | Third-party source terms apply to underlying results; TRT Provider Guide credit covers original annotations and calculations only. | |
| M-20 | measurement | UK men: Felt disgusted because of body image (Last year) | 12 | percent | UK men 18+ | UK | 2,103 men (4,505 adults) | March 25-26, 2019 | 2019 | Opt-in online panel, weighted (YouGov) | feelings | Not stated in source | Mental Health Foundation, Body image in adulthood (2019 YouGov survey) | https://www.mentalhealth.org.uk/our-work/research/body-image-how-we-think-and-feel-about-our-bodies/body-image-adulthood | Not stated in source | In the March 2019 YouGov survey for the Mental Health Foundation, 12% of UK men said they had felt disgusted because of body image in the past year. | 2026-09-29 | Verified self-report; not clinical diagnosis | Male-results release or Body image in adulthood: male-specific findings | Original commissioning organization reports | Table 6 | Not stated in source | Third-party source terms apply to underlying results; TRT Provider Guide credit covers original annotations and calculations only. | |
| M-21 | measurement | UK men: Felt satisfied because of body image (Last year) | 23 | percent | UK men 18+ | UK | 2,103 men (4,505 adults) | March 25-26, 2019 | 2019 | Opt-in online panel, weighted (YouGov) | feelings | Not stated in source | Mental Health Foundation, Body image in adulthood (2019 YouGov survey) | https://www.mentalhealth.org.uk/our-work/research/body-image-how-we-think-and-feel-about-our-bodies/body-image-adulthood | Not stated in source | In the March 2019 YouGov survey for the Mental Health Foundation, 23% of UK men said they had felt satisfied because of body image in the past year. | 2026-09-29 | Verified self-report; not clinical diagnosis | Male-results release or Body image in adulthood: male-specific findings | Original commissioning organization reports | Table 6 | Not stated in source | Third-party source terms apply to underlying results; TRT Provider Guide credit covers original annotations and calculations only. | |
| M-22 | measurement | UK men: Dressed to hide parts of their body (Last year) | 21 | percent | UK men 18+ | UK | 2,103 men (4,505 adults) | March 25-26, 2019 | 2019 | Opt-in online panel, weighted (YouGov) | feelings | Not stated in source | Mental Health Foundation, male-results release (2019 YouGov survey) | https://www.mentalhealth.org.uk/about-us/news/millions-men-uk-affected-body-image-issues-mental-health-foundation-survey | Not stated in source | In the March 2019 YouGov survey for the Mental Health Foundation, 21% of UK men said they had dressed to hide parts of their body in the past year. | 2026-09-29 | Verified self-report; not clinical diagnosis | Male-results release or Body image in adulthood: male-specific findings | Original commissioning organization reports | Table 6 | Not stated in source | Third-party source terms apply to underlying results; TRT Provider Guide credit covers original annotations and calculations only. | |
| M-23 | measurement | UK men: Compared themselves negatively to others (Last year) | 22 | percent | UK men 18+ | UK | 2,103 men (4,505 adults) | March 25-26, 2019 | 2019 | Opt-in online panel, weighted (YouGov) | feelings | Not stated in source | Mental Health Foundation, male-results release (2019 YouGov survey) | https://www.mentalhealth.org.uk/about-us/news/millions-men-uk-affected-body-image-issues-mental-health-foundation-survey | Not stated in source | In the March 2019 YouGov survey for the Mental Health Foundation, 22% of UK men said they had compared themselves negatively to others because of body image in the past year. | 2026-09-29 | Verified self-report; not clinical diagnosis | Male-results release or Body image in adulthood: male-specific findings | Original commissioning organization reports | Table 6 | Not stated in source | Third-party source terms apply to underlying results; TRT Provider Guide credit covers original annotations and calculations only. | |
| M-24 | measurement | UK men: Had suicidal thoughts or feelings because of body image (Recall period not stated) | 11 | percent | UK men 18+ | UK | 2,103 men (4,505 adults) | March 25-26, 2019 | 2019 | Opt-in online panel, weighted (YouGov) | feelings | Not stated in source | Mental Health Foundation, Body image in adulthood (2019 YouGov survey) | https://www.mentalhealth.org.uk/our-work/research/body-image-how-we-think-and-feel-about-our-bodies/body-image-adulthood | Not stated in source | In the March 2019 YouGov survey for the Mental Health Foundation, 11% of UK men said they had had suicidal thoughts or feelings because of body image. The inspected report does not state the recall period for this question. | 2026-09-29 | Verified self-report; not clinical diagnosis | Male-results release or Body image in adulthood: male-specific findings | Original commissioning organization reports | Table 6 | Not stated in source | Third-party source terms apply to underlying results; TRT Provider Guide credit covers original annotations and calculations only. | |
| M-25 | measurement | UK men: Deliberately hurt themselves because of body image (Period not stated) | 4 | percent | UK men 18+ | UK | 2,103 men (4,505 adults) | March 25-26, 2019 | 2019 | Opt-in online panel, weighted (YouGov) | feelings | Not stated in source | Mental Health Foundation, male-results release (2019 YouGov survey) | https://www.mentalhealth.org.uk/about-us/news/millions-men-uk-affected-body-image-issues-mental-health-foundation-survey | Not stated in source | In the March 2019 YouGov survey for the Mental Health Foundation, 4% of UK men said they had deliberately hurt themselves because of body image. The inspected report does not state the recall period for this question. | 2026-09-29 | Verified self-report; not clinical diagnosis | Male-results release or Body image in adulthood: male-specific findings | Original commissioning organization reports | Table 6 | Not stated in source | Third-party source terms apply to underlying results; TRT Provider Guide credit covers original annotations and calculations only. | |
| M-26 | measurement | U.S. men age 20+ who tried to lose weight in the past 12 months | 41.7 | percent (age-adjusted) | U.S. men 20+ | U.S. | Male item-specific n not stated in data brief; weighted NHANES estimate | 2013-2016 | 2018 | National random sample (NHANES) | behaviors | Not stated in source | CDC NCHS Data Brief No. 313 (July 2018) | https://www.cdc.gov/nchs/products/databriefs/db313.htm | Not stated in source | In 2013-2016, the age-adjusted estimate of U.S. men ages 20+ who tried to lose weight in the past year was 41.7%. The definition includes intentional loss of at least 10 pounds. | 2026-09-29 | Verified; age-adjusted overall estimate | Figure 1; definitions; accompanying data tables | Original CDC brief and data table | Table 9 all ages | Not stated in source | Third-party source terms apply to underlying results; TRT Provider Guide credit covers original annotations and calculations only. | |
| M-27 | measurement | U.S. men who tried to lose weight in the past 12 months, trend | 35.5 (2007-2008) to 42.2 (2015-2016) | percent (age-adjusted) | U.S. men 20+ | U.S. | NHANES samples | 2007-2008 to 2015-2016 | 2018 | National random sample (NHANES) | behaviors | Not stated in source | CDC MMWR QuickStats. 2018;67(41):1166 | https://www.cdc.gov/mmwr/volumes/67/wr/mm6741a10.htm | 42.2 - 35.5 = 6.7 percentage points | The age-adjusted share of U.S. men ages 20+ who tried to lose weight was 35.5% in 2007-2008 and 42.2% in 2015-2016. Like the 2013-2016 brief, this counts trying or intentional loss of at least 10 pounds. | 2026-09-29 | Verified; same definition as M-26, different time windows | QuickStats text and figure footnote | Original CDC MMWR report | Table 9 trend | Not stated in source | Third-party source terms apply to underlying results; TRT Provider Guide credit covers original annotations and calculations only. | |
| M-28 | measurement | U.S. men meeting survey criteria for body dysmorphic disorder | 2.2 | percent | U.S. men completing BDD module in household telephone survey | U.S. | 2,048 adults in module; male subgroup n not available in accessible abstract; 2,513 interviewed overall | Spring and summer 2004 | 2008 | National random sample (household telephone survey) | survey disorder criteria | Not stated in source | Koran LM, et al. CNS Spectrums. 2008;13(4):316-322 | https://www.cambridge.org/core/journals/cns-spectrums/article/abs/prevalence-of-body-dysmorphic-disorder-in-the-united-states-adult-population/664486A24D8E14CD236C506295E46C48 | Not stated in source | In a 2004 U.S. household telephone survey, 2.2% of men completing its BDD module met the survey criteria for body dysmorphic disorder. Trained lay interviewers, not clinicians, performed the interviews. | 2026-09-29 | Verified in abstract; lay interviewers, not clinicians | Methods and Results in original abstract | Original publisher abstract | Table 7 BDD | Not stated in source | Third-party source terms apply to underlying results; TRT Provider Guide credit covers original annotations and calculations only. | |
| M-29 | measurement | Boys and men aged 15-35 with probable muscle dysmorphia | 2.8 | percent | Boys and men aged 15-35 recruited by Instagram and Snapchat ads | Canada and U.S. | 1,488 (41 met criteria) | March-April 2024 | 2025 | Volunteer sample (social media ads) | survey disorder criteria | Not stated in source | Ganson KT, et al. Journal of Eating Disorders. 2025;13:47 | https://pmc.ncbi.nlm.nih.gov/articles/PMC11916914/ | 41 / 1488 * 100 = 2.7554%, rounded to 2.8% | In a March-April 2024 survey of 1,488 boys and men ages 15-35 recruited through Instagram/Snapchat ads in Canada and the U.S., 41 (2.8%; 95% CI 2.0-3.7%) met criteria for probable muscle dysmorphia, without a clinical interview. | 2026-09-29 | Verified; probable cases, not clinical interviews; 95% CI 2.0-3.7% | Methods, Participants, Muscle dysmorphia, Results | Primary full text | Table 7 probable MD | Not stated in source | Third-party source terms apply to underlying results; TRT Provider Guide credit covers original annotations and calculations only. | |
| M-30 | measurement | U.S. men with lifetime anorexia / bulimia / binge-eating disorder | 0.12 / 0.08 / 0.42 | percent | U.S. adults 18+ | U.S. | Table 1 sex-specific analysis; paper abstract says 36,306, Methods says 36,309 overall; discrepancy not resolved; not per-disorder case denominator | April 2012-June 2013 | 2018 | National random sample (NESARC-III) | survey disorder criteria | Not stated in source | Udo T, Grilo CM. Biological Psychiatry. 2018;84(5):345-354 | https://pmc.ncbi.nlm.nih.gov/articles/PMC6097933/ | Not stated in source | In 2012-2013 NESARC-III, weighted lifetime prevalence in U.S. men was 0.12% for anorexia, 0.08% for bulimia and 0.42% for binge-eating disorder. These are prevalence rates within men, not male shares of all cases. | 2026-09-29 | Sex-specific rates verified directly in Table 1; overall N differs within paper | Table 1; Methods and Abstract for sample-size discrepancy | Primary full text | Table 8A male 2012-2013; Table 7 AN/BED | Not stated in source | Third-party source terms apply to underlying results; TRT Provider Guide credit covers original annotations and calculations only. | |
| M-31 | measurement | U.S. teen boys (grades 8, 10, 12) past-year anabolic steroid use | 2.92 (2001-2002) to 0.78 (2023-2024) | percent | U.S. boys in grades 8, 10 and 12 | U.S. | 874,931 adolescents across all sexes and years in full study; male per-window n not verified | 2001-2024 | 2026 | National random sample (Monitoring the Future) | behaviors | Not stated in source | Veliz P, Li J, Mattar K, Pero R, Jardine J. Ann Epidemiol. 2026;120:110107. DOI 10.1016/j.annepidem.2026.110107 | https://www.sciencedirect.com/sdfe/pdf/download/eid/1-s2.0-S1047279726001055/first-page-pdf | Not stated in source | Past-year anabolic steroid use among U.S. boys in grades 8, 10 and 12 fell from 2.92% in 2001-2002 to 0.78% in 2023-2024 (Monitoring the Future). | 2026-09-29 | Verified in primary first-page Results; full article/supplement not fully accessible | Publisher first page: Methods and Results | Original publisher public first page | Table 10 | Not stated in source | Third-party source terms apply to underlying results; TRT Provider Guide credit covers original annotations and calculations only. | |
| M-32 | measurement | U.S. teen boys past-year creatine use | 8.71 (2019-2020) to 16.57 (2023-2024) | percent | U.S. boys in grades 8, 10 and 12 | U.S. | 874,931 adolescents across all sexes and years in full study; male per-window n not verified | 2019-2024 | 2026 | National random sample (Monitoring the Future) | behaviors | Not stated in source | Veliz P, Li J, Mattar K, Pero R, Jardine J. Ann Epidemiol. 2026;120:110107. DOI 10.1016/j.annepidem.2026.110107 | https://www.sciencedirect.com/sdfe/pdf/download/eid/1-s2.0-S1047279726001055/first-page-pdf | Not stated in source | Past-year creatine use among U.S. boys in grades 8, 10 and 12 rose from 8.71% in 2019-2020 to 16.57% in 2023-2024 (Monitoring the Future). | 2026-09-29 | Verified in primary first-page Results; full article/supplement not fully accessible | Publisher first page: Methods and Results | Original publisher public first page | Table 10 | Not stated in source | Third-party source terms apply to underlying results; TRT Provider Guide credit covers original annotations and calculations only. | |
| M-33 | measurement | Americans aged 13-50 who have ever used anabolic-androgenic steroids | 2.9 to 4.0 million | people (estimate) | Americans aged 13-50 | U.S. | Model built on four national youth datasets | Youth surveys before 2013 | 2014 | Modeled estimate | behaviors | Not stated in source | Pope HG Jr, Kanayama G, Athey A, et al. Am J Addict. 2014;23(4):371-377 | https://pubmed.ncbi.nlm.nih.gov/24112239/ | Not stated in source | A paper published in 2014 estimated that 2.9-4.0 million Americans ages 13-50 had used anabolic-androgenic steroids. The modeled total includes women and is not a current count. | 2026-09-29 | Historical modeled estimate, not a new count or male-only estimate | Methods and Results | Original abstract | Not stated in source | Not stated in source | Third-party source terms apply to underlying results; TRT Provider Guide credit covers original annotations and calculations only. | |
| M-34 | measurement | Anabolic steroid users who started before age 20 | 22 | percent | Anabolic steroid users in nine pooled studies | Mostly U.S. | Nine studies | Various | 2014 | Pooled estimate | behaviors | Not stated in source | Pope HG Jr, et al. Am J Addict. 2014;23(4):371-377 | https://pubmed.ncbi.nlm.nih.gov/24112239/ | Not stated in source | Across nine studies pooled in a paper published in 2014, 22% of anabolic-androgenic steroid users had started before age 20 (95% CI 19-25%). | 2026-09-29 | Verified pooled historical estimate; not a present-day national initiation rate | Methods and Results | Original abstract | Not stated in source | Not stated in source | Third-party source terms apply to underlying results; TRT Provider Guide credit covers original annotations and calculations only. | |
| M-35 | measurement | Pooled lifetime anabolic steroid use in male study samples | 6.4 | percent | Mixed samples worldwide, weighted toward athletes, gym users and prisoners | Global | 187 studies | Various | 2014 | Pooled estimate (meta-analysis) | behaviors | Not stated in source | Sagoe D, et al. Ann Epidemiol. 2014;24(5):383-398; caveat from Anawalt BD, J Clin Endocrinol Metab 2019 | https://doi.org/10.1016/j.annepidem.2014.01.009 | Not stated in source | Sagoe and colleagues pooled 187 studies in a 2014 meta-analysis; the male lifetime-use estimate was 6.4% (95% CI 5.3-7.7%). It is not a representative current rate for all men worldwide. | 2026-09-29 | Primary pooled estimate verified; sample-composition caution independently checked in Anawalt 2019 | Original publisher Abstract, Methods and Results; Anawalt review for selection limits | Original abstract and accessible publisher sections | Not stated in source | Not stated in source | Third-party source terms apply to underlying results; TRT Provider Guide credit covers original annotations and calculations only. | |
| M-36 | measurement | Social media use and body image in physically active men (association, no prevalence) | Association only | n/a | Physically active UK men aged 18-50 recruited on Instagram and Facebook | UK | 224 | 2024 or earlier (not stated in release) | 2024 | Volunteer sample (social media recruitment) | feelings | Not stated in source | Bell C, Cocks AJ, Hills L, Kerner C. New Media & Society (2024); Brunel University of London release, Oct 17, 2024 | https://www.brunel.ac.uk/news-and-events/news/articles/New-study-Social-media-impacts-male-body-image | Not stated in source | In a study published in 2024 of 224 physically active UK men ages 18-50, passive social-media use was associated with more appearance awareness and drive for muscularity; active use was associated with less body satisfaction. The recruitment dates were not stated in the inspected university release. | 2026-09-29 | Association reported by original research institution; collection dates not established | Brunel release, October 17, 2024 | Original research institution release; not full study | Not stated in source | Not stated in source | Third-party source terms apply to underlying results; TRT Provider Guide credit covers original annotations and calculations only. | |
| M-37 | measurement | Very self-conscious | 30 | percent | U.S. adult-citizen women | United States | 635 women unweighted; 1,083 total | August 19-22, 2025 | 2025 | Opt-in online panel, weighted | feelings | Not stated in source | YouGov plc, Public Nudity poll results | https://d3nkl3psvxxpe9.cloudfront.net/documents/Public_Nudity_poll_results.pdf | Not stated in source | In YouGov's August 2025 U.S. adult-citizen poll, 30% of women selected "Very self-conscious" about their appearance. | 2026-09-29 | Verified | Self-consciousness question, printed p. 25 | Original producer PDF table | Table 2 women: Very self-conscious | Not stated in source | Source: YouGov plc, 2025, © All rights reserved. https://yougov.com/en-us/about/terms/public-data-license; original-source link required; this compilation does not grant rights to underlying poll data. | |
| M-38 | measurement | Fairly self-conscious | 40 | percent | U.S. adult-citizen women | United States | 635 women unweighted; 1,083 total | August 19-22, 2025 | 2025 | Opt-in online panel, weighted | feelings | Not stated in source | YouGov plc, Public Nudity poll results | https://d3nkl3psvxxpe9.cloudfront.net/documents/Public_Nudity_poll_results.pdf | Not stated in source | In YouGov's August 2025 U.S. adult-citizen poll, 40% of women selected "Fairly self-conscious" about their appearance. | 2026-09-29 | Verified | Self-consciousness question, printed p. 25 | Original producer PDF table | Table 2 women: Fairly self-conscious | Not stated in source | Source: YouGov plc, 2025, © All rights reserved. https://yougov.com/en-us/about/terms/public-data-license; original-source link required; this compilation does not grant rights to underlying poll data. | |
| M-39 | measurement | Not very self-conscious | 17 | percent | U.S. adult-citizen women | United States | 635 women unweighted; 1,083 total | August 19-22, 2025 | 2025 | Opt-in online panel, weighted | feelings | Not stated in source | YouGov plc, Public Nudity poll results | https://d3nkl3psvxxpe9.cloudfront.net/documents/Public_Nudity_poll_results.pdf | Not stated in source | In YouGov's August 2025 U.S. adult-citizen poll, 17% of women selected "Not very self-conscious" about their appearance. | 2026-09-29 | Verified | Self-consciousness question, printed p. 25 | Original producer PDF table | Table 2 women: Not very self-conscious | Not stated in source | Source: YouGov plc, 2025, © All rights reserved. https://yougov.com/en-us/about/terms/public-data-license; original-source link required; this compilation does not grant rights to underlying poll data. | |
| M-40 | measurement | Not self-conscious at all | 7 | percent | U.S. adult-citizen women | United States | 635 women unweighted; 1,083 total | August 19-22, 2025 | 2025 | Opt-in online panel, weighted | feelings | Not stated in source | YouGov plc, Public Nudity poll results | https://d3nkl3psvxxpe9.cloudfront.net/documents/Public_Nudity_poll_results.pdf | Not stated in source | In YouGov's August 2025 U.S. adult-citizen poll, 7% of women selected "Not self-conscious at all" about their appearance. | 2026-09-29 | Verified | Self-consciousness question, printed p. 25 | Original producer PDF table | Table 2 women: Not self-conscious at all | Not stated in source | Source: YouGov plc, 2025, © All rights reserved. https://yougov.com/en-us/about/terms/public-data-license; original-source link required; this compilation does not grant rights to underlying poll data. | |
| M-41 | measurement | Don't know | 3 | percent | U.S. adult-citizen women | United States | 635 women unweighted; 1,083 total | August 19-22, 2025 | 2025 | Opt-in online panel, weighted | feelings | Not stated in source | YouGov plc, Public Nudity poll results | https://d3nkl3psvxxpe9.cloudfront.net/documents/Public_Nudity_poll_results.pdf | Not stated in source | In YouGov's August 2025 U.S. adult-citizen poll, 3% of women selected "Don't know" about their appearance. | 2026-09-29 | Verified | Self-consciousness question, printed p. 25 | Original producer PDF table | Table 2 women: Don't know | Not stated in source | Source: YouGov plc, 2025, © All rights reserved. https://yougov.com/en-us/about/terms/public-data-license; original-source link required; this compilation does not grant rights to underlying poll data. | |
| M-42 | measurement | Prefer not to say | 2 | percent | U.S. adult-citizen women | United States | 635 women unweighted; 1,083 total | August 19-22, 2025 | 2025 | Opt-in online panel, weighted | feelings | Not stated in source | YouGov plc, Public Nudity poll results | https://d3nkl3psvxxpe9.cloudfront.net/documents/Public_Nudity_poll_results.pdf | Not stated in source | In YouGov's August 2025 U.S. adult-citizen poll, 2% of women selected "Prefer not to say" about their appearance. | 2026-09-29 | Verified | Self-consciousness question, printed p. 25 | Original producer PDF table | Table 2 women: Prefer not to say | Not stated in source | Source: YouGov plc, 2025, © All rights reserved. https://yougov.com/en-us/about/terms/public-data-license; original-source link required; this compilation does not grant rights to underlying poll data. | |
| M-43 | measurement | Satisfied with Overall appearance | 67 | percent | U.S. men in committed relationships, Survey 2 main analysis | United States | 409 men main analysis; per-item n not independently established | 2016 | 2020 | Internet panel survey | feelings | Not stated in source | Frederick et al., Body Image 2020;32:70-84 | https://www.academia.edu/99286244/The_Happy_American_Body_2_0_Predictors_of_affective_body_satisfaction_in_two_U_S_national_internet_panel_surveys | Not stated in source | In Frederick and colleagues' 2016 U.S. partnered-adult sample, 67% of men were satisfied with their overall appearance. | 2026-09-29 | Verified | Survey 2 satisfaction results | Author full-text copy and publisher abstract | Table 3 Overall appearance satisfied | Not stated in source | Underlying source rights retained; no third-party data license granted by TRT Provider Guide. | |
| M-44 | measurement | Satisfied with Overall body | 61 | percent | U.S. men in committed relationships, Survey 2 main analysis | United States | 409 men main analysis; per-item n not independently established | 2016 | 2020 | Internet panel survey | feelings | Not stated in source | Frederick et al., Body Image 2020;32:70-84 | https://www.academia.edu/99286244/The_Happy_American_Body_2_0_Predictors_of_affective_body_satisfaction_in_two_U_S_national_internet_panel_surveys | Not stated in source | In Frederick and colleagues' 2016 U.S. partnered-adult sample, 61% of men were satisfied with their overall body. | 2026-09-29 | Verified | Survey 2 satisfaction results | Author full-text copy and publisher abstract | Table 3 Overall body satisfied | Not stated in source | Underlying source rights retained; no third-party data license granted by TRT Provider Guide. | |
| M-45 | measurement | Satisfied with Weight | 54 | percent | U.S. men in committed relationships, Survey 2 main analysis | United States | 409 men main analysis; per-item n not independently established | 2016 | 2020 | Internet panel survey | feelings | Not stated in source | Frederick et al., Body Image 2020;32:70-84 | https://www.academia.edu/99286244/The_Happy_American_Body_2_0_Predictors_of_affective_body_satisfaction_in_two_U_S_national_internet_panel_surveys | Not stated in source | In Frederick and colleagues' 2016 U.S. partnered-adult sample, 54% of men were satisfied with their weight. | 2026-09-29 | Verified | Survey 2 satisfaction results | Author full-text copy and publisher abstract | Table 3 Weight satisfied | Not stated in source | Underlying source rights retained; no third-party data license granted by TRT Provider Guide. | |
| M-46 | measurement | Satisfied with Muscle tone/size | 56 | percent | U.S. men in committed relationships, Survey 2 main analysis | United States | 409 men main analysis; per-item n not independently established | 2016 | 2020 | Internet panel survey | feelings | Not stated in source | Frederick et al., Body Image 2020;32:70-84 | https://www.academia.edu/99286244/The_Happy_American_Body_2_0_Predictors_of_affective_body_satisfaction_in_two_U_S_national_internet_panel_surveys | Not stated in source | In Frederick and colleagues' 2016 U.S. partnered-adult sample, 56% of men were satisfied with their muscle tone/size. | 2026-09-29 | Verified | Survey 2 satisfaction results | Author full-text copy and publisher abstract | Table 3 Muscle tone/size satisfied | Not stated in source | Underlying source rights retained; no third-party data license granted by TRT Provider Guide. | |
| M-47 | measurement | Completely pressured | 11 | percent | U.S. males ages 16+ | United States | 653 male respondents unweighted; weighted male base 636; 1,302 total | April 26-27, 2021 | 2021 | Opt-in online panel, weighted | feelings | Not stated in source | YouGov Body Image Study 2021 | https://d3nkl3psvxxpe9.cloudfront.net/documents/YouGov_Body_Image_Data.pdf | Not stated in source | In YouGov's April 2021 survey, 11% of U.S. males ages 16+ selected "Completely pressured". The question is about pressure to have a particular body type. | 2026-09-29 | Verified | Pressure Q5 or media-unattainability question, male column | Original producer PDF table | Table 5 Completely pressured | Not stated in source | Source: YouGov plc, 2021, © All rights reserved. https://yougov.com/en-us/about/terms/public-data-license; original-source link required; this compilation does not grant rights to underlying poll data. | |
| M-48 | measurement | Somewhat pressured | 32 | percent | U.S. males ages 16+ | United States | 653 male respondents unweighted; weighted male base 636; 1,302 total | April 26-27, 2021 | 2021 | Opt-in online panel, weighted | feelings | Not stated in source | YouGov Body Image Study 2021 | https://d3nkl3psvxxpe9.cloudfront.net/documents/YouGov_Body_Image_Data.pdf | Not stated in source | In YouGov's April 2021 survey, 32% of U.S. males ages 16+ selected "Somewhat pressured". The question is about pressure to have a particular body type. | 2026-09-29 | Verified | Pressure Q5 or media-unattainability question, male column | Original producer PDF table | Table 5 Somewhat pressured | Not stated in source | Source: YouGov plc, 2021, © All rights reserved. https://yougov.com/en-us/about/terms/public-data-license; original-source link required; this compilation does not grant rights to underlying poll data. | |
| M-49 | measurement | Not under too much pressure | 31 | percent | U.S. males ages 16+ | United States | 653 male respondents unweighted; weighted male base 636; 1,302 total | April 26-27, 2021 | 2021 | Opt-in online panel, weighted | feelings | Not stated in source | YouGov Body Image Study 2021 | https://d3nkl3psvxxpe9.cloudfront.net/documents/YouGov_Body_Image_Data.pdf | Not stated in source | In YouGov's April 2021 survey, 31% of U.S. males ages 16+ selected "Not under too much pressure". The question is about pressure to have a particular body type. | 2026-09-29 | Verified | Pressure Q5 or media-unattainability question, male column | Original producer PDF table | Table 5 Not under too much pressure | Not stated in source | Source: YouGov plc, 2021, © All rights reserved. https://yougov.com/en-us/about/terms/public-data-license; original-source link required; this compilation does not grant rights to underlying poll data. | |
| M-50 | measurement | Not under pressure at all | 25 | percent | U.S. males ages 16+ | United States | 653 male respondents unweighted; weighted male base 636; 1,302 total | April 26-27, 2021 | 2021 | Opt-in online panel, weighted | feelings | Not stated in source | YouGov Body Image Study 2021 | https://d3nkl3psvxxpe9.cloudfront.net/documents/YouGov_Body_Image_Data.pdf | Not stated in source | In YouGov's April 2021 survey, 25% of U.S. males ages 16+ selected "Not under pressure at all". The question is about pressure to have a particular body type. | 2026-09-29 | Verified | Pressure Q5 or media-unattainability question, male column | Original producer PDF table | Table 5 Not under pressure at all | Not stated in source | Source: YouGov plc, 2021, © All rights reserved. https://yougov.com/en-us/about/terms/public-data-license; original-source link required; this compilation does not grant rights to underlying poll data. | |
| M-51 | measurement | Do not know: pressure | 2 | percent | U.S. males ages 16+ | United States | 653 male respondents unweighted; weighted male base 636; 1,302 total | April 26-27, 2021 | 2021 | Opt-in online panel, weighted | feelings | Not stated in source | YouGov Body Image Study 2021 | https://d3nkl3psvxxpe9.cloudfront.net/documents/YouGov_Body_Image_Data.pdf | Not stated in source | In YouGov's April 2021 survey, 2% of U.S. males ages 16+ selected "Do not know: pressure". The question is about pressure to have a particular body type. | 2026-09-29 | Verified | Pressure Q5 or media-unattainability question, male column | Original producer PDF table | Table 5 Do not know: pressure | Not stated in source | Source: YouGov plc, 2021, © All rights reserved. https://yougov.com/en-us/about/terms/public-data-license; original-source link required; this compilation does not grant rights to underlying poll data. | |
| M-52 | measurement | Media promotes unattainable male body image | 56 | percent | U.S. males ages 16+ | United States | 653 male respondents unweighted; weighted male base 636; 1,302 total | April 26-27, 2021 | 2021 | Opt-in online panel, weighted | feelings | Not stated in source | YouGov Body Image Study 2021 | https://d3nkl3psvxxpe9.cloudfront.net/documents/YouGov_Body_Image_Data.pdf | Not stated in source | In YouGov's April 2021 survey, 56% of U.S. males ages 16+ selected "Media promotes unattainable male body image". The question is about whether media promotes an unattainable male body image. | 2026-09-29 | Verified | Pressure Q5 or media-unattainability question, male column | Original producer PDF table | Table 5 Media promotes unattainable male body image | Not stated in source | Source: YouGov plc, 2021, © All rights reserved. https://yougov.com/en-us/about/terms/public-data-license; original-source link required; this compilation does not grant rights to underlying poll data. | |
| M-53 | measurement | Media does not promote unattainable male body image | 32 | percent | U.S. males ages 16+ | United States | 653 male respondents unweighted; weighted male base 636; 1,302 total | April 26-27, 2021 | 2021 | Opt-in online panel, weighted | feelings | Not stated in source | YouGov Body Image Study 2021 | https://d3nkl3psvxxpe9.cloudfront.net/documents/YouGov_Body_Image_Data.pdf | Not stated in source | In YouGov's April 2021 survey, 32% of U.S. males ages 16+ selected "Media does not promote unattainable male body image". The question is about whether media promotes an unattainable male body image. | 2026-09-29 | Verified | Pressure Q5 or media-unattainability question, male column | Original producer PDF table | Table 5 Media does not promote unattainable male body image | Not stated in source | Source: YouGov plc, 2021, © All rights reserved. https://yougov.com/en-us/about/terms/public-data-license; original-source link required; this compilation does not grant rights to underlying poll data. | |
| M-54 | measurement | Do not know: media | 12 | percent | U.S. males ages 16+ | United States | 653 male respondents unweighted; weighted male base 636; 1,302 total | April 26-27, 2021 | 2021 | Opt-in online panel, weighted | feelings | Not stated in source | YouGov Body Image Study 2021 | https://d3nkl3psvxxpe9.cloudfront.net/documents/YouGov_Body_Image_Data.pdf | Not stated in source | In YouGov's April 2021 survey, 12% of U.S. males ages 16+ selected "Do not know: media". The question is about whether media promotes an unattainable male body image. | 2026-09-29 | Verified | Pressure Q5 or media-unattainability question, male column | Original producer PDF table | Table 5 Do not know: media | Not stated in source | Source: YouGov plc, 2021, © All rights reserved. https://yougov.com/en-us/about/terms/public-data-license; original-source link required; this compilation does not grant rights to underlying poll data. | |
| M-55 | measurement | Publisher-reported completely or somewhat pressured | 42 | percent | U.S. males ages 16+ | United States | 653 male respondents unweighted | April 26-27, 2021 | 2021 | Opt-in online panel, weighted | feelings | Not stated in source | YouGov Body Image Study 2021 | https://yougov.com/en-us/articles/36099-yougov-body-image-study-2021 | Not stated in source | In an April 2021 YouGov survey, 42% of U.S. males 16 and older said they felt completely or somewhat pressured to have a particular body type. | 2026-09-29 | Publisher says 42%; rounded pressure cells sum to 43%; rounding is a possible explanation, not established from microdata | Article male aggregate | Original producer article | Table 5 accompanying text | Not stated in source | Source: YouGov plc, 2021, © All rights reserved. https://yougov.com/en-us/about/terms/public-data-license; original-source link required; this compilation does not grant rights to underlying poll data. | |
| M-56 | measurement | Muscularity-oriented behavior composite | 21.9 | percent | U.S. male young adults ages 18-24 at follow-up | United States | 7,018 men; 14,891 total analytic sample | 2001-2002 | 2019 | National probability-based longitudinal sample | behaviors | Not stated in source | Nagata et al., Int J Eat Disord. 2019;52:1380-1388 | https://pmc.ncbi.nlm.nih.gov/articles/PMC6901753/ | Not stated in source | At the 2001-2002 follow-up, 21.9% (about 22%) of U.S. men aged 18-24 reported a behavior in Nagata and colleagues' muscularity-oriented composite. It included eating more or differently, supplements or anabolic steroids for weight gain/bulking, not a clinical diagnosis. | 2026-09-29 | Verified | Table 1 | Primary full text | Table 1 precise value; Table 7 rounded to 22 | Not stated in source | Underlying source rights retained; no third-party data license granted by TRT Provider Guide. | |
| M-57 | measurement | Lifetime anorexia prevalence within men | 0.3 | percent | U.S. men ages 18+ | United States | 1,220 male and 1,760 female respondents in 2,980-person ED module | February 2001-December 2003 | 2007 | National probability household survey | survey disorder criteria | Not stated in source | Hudson et al., Biol Psychiatry 2007;61:348-358 | https://pmc.ncbi.nlm.nih.gov/articles/PMC1892232/ | Not stated in source | In the 2001-2003 NCS-R, weighted lifetime anorexia prevalence was 0.3% within U.S. men, not their share of all cases. | 2026-09-29 | Verified | Table 1 lifetime prevalence | Primary full text | Table 8A men 2001-2003 anorexia | Not stated in source | Underlying source rights retained; no third-party data license granted by TRT Provider Guide. | |
| M-58 | measurement | Lifetime bulimia prevalence within men | 0.5 | percent | U.S. men ages 18+ | United States | 1,220 male and 1,760 female respondents in 2,980-person ED module | February 2001-December 2003 | 2007 | National probability household survey | survey disorder criteria | Not stated in source | Hudson et al., Biol Psychiatry 2007;61:348-358 | https://pmc.ncbi.nlm.nih.gov/articles/PMC1892232/ | Not stated in source | In the 2001-2003 NCS-R, weighted lifetime bulimia prevalence was 0.5% within U.S. men, not their share of all cases. | 2026-09-29 | Verified | Table 1 lifetime prevalence | Primary full text | Table 8A men 2001-2003 bulimia | Not stated in source | Underlying source rights retained; no third-party data license granted by TRT Provider Guide. | |
| M-59 | measurement | Lifetime binge-eating disorder prevalence within men | 2.0 | percent | U.S. men ages 18+ | United States | 1,220 male and 1,760 female respondents in 2,980-person ED module | February 2001-December 2003 | 2007 | National probability household survey | survey disorder criteria | Not stated in source | Hudson et al., Biol Psychiatry 2007;61:348-358 | https://pmc.ncbi.nlm.nih.gov/articles/PMC1892232/ | Not stated in source | In the 2001-2003 NCS-R, weighted lifetime binge-eating disorder prevalence was 2.0% within U.S. men, not their share of all cases. | 2026-09-29 | Verified | Table 1 lifetime prevalence | Primary full text | Table 8A men 2001-2003 binge-eating disorder | Not stated in source | Underlying source rights retained; no third-party data license granted by TRT Provider Guide. | |
| M-60 | measurement | Lifetime anorexia prevalence within women | 0.9 | percent | U.S. women ages 18+ | United States | 1,220 male and 1,760 female respondents in 2,980-person ED module | February 2001-December 2003 | 2007 | National probability household survey | survey disorder criteria | Not stated in source | Hudson et al., Biol Psychiatry 2007;61:348-358 | https://pmc.ncbi.nlm.nih.gov/articles/PMC1892232/ | Not stated in source | In the 2001-2003 NCS-R, weighted lifetime anorexia prevalence was 0.9% within U.S. women, not their share of all cases. | 2026-09-29 | Verified | Table 1 lifetime prevalence | Primary full text | Table 8A women 2001-2003 anorexia | Not stated in source | Underlying source rights retained; no third-party data license granted by TRT Provider Guide. | |
| M-61 | measurement | Lifetime bulimia prevalence within women | 1.5 | percent | U.S. women ages 18+ | United States | 1,220 male and 1,760 female respondents in 2,980-person ED module | February 2001-December 2003 | 2007 | National probability household survey | survey disorder criteria | Not stated in source | Hudson et al., Biol Psychiatry 2007;61:348-358 | https://pmc.ncbi.nlm.nih.gov/articles/PMC1892232/ | Not stated in source | In the 2001-2003 NCS-R, weighted lifetime bulimia prevalence was 1.5% within U.S. women, not their share of all cases. | 2026-09-29 | Verified | Table 1 lifetime prevalence | Primary full text | Table 8A women 2001-2003 bulimia | Not stated in source | Underlying source rights retained; no third-party data license granted by TRT Provider Guide. | |
| M-62 | measurement | Lifetime binge-eating disorder prevalence within women | 3.5 | percent | U.S. women ages 18+ | United States | 1,220 male and 1,760 female respondents in 2,980-person ED module | February 2001-December 2003 | 2007 | National probability household survey | survey disorder criteria | Not stated in source | Hudson et al., Biol Psychiatry 2007;61:348-358 | https://pmc.ncbi.nlm.nih.gov/articles/PMC1892232/ | Not stated in source | In the 2001-2003 NCS-R, weighted lifetime binge-eating disorder prevalence was 3.5% within U.S. women, not their share of all cases. | 2026-09-29 | Verified | Table 1 lifetime prevalence | Primary full text | Table 8A women 2001-2003 binge-eating disorder | Not stated in source | Underlying source rights retained; no third-party data license granted by TRT Provider Guide. | |
| M-63 | measurement | Lifetime anorexia prevalence within men | 0.12 | percent | U.S. men ages 18+ | United States | Sex-specific population estimate; not a case-share denominator; overall N discrepancy described in M-30 | April 2012-June 2013 | 2018 | National probability household survey | survey disorder criteria | Not stated in source | Udo and Grilo, Biol Psychiatry 2018;84:345-354 | https://pmc.ncbi.nlm.nih.gov/articles/PMC6097933/ | Not stated in source | In 2012-2013 NESARC-III, weighted lifetime anorexia prevalence was 0.12% within U.S. men. This is not their share of all cases. | 2026-09-29 | Verified | Table 1 lifetime prevalence | Primary full text | Table 8A men 2012-2013 anorexia | Not stated in source | Underlying source rights retained; no third-party data license granted by TRT Provider Guide. | |
| M-64 | measurement | Lifetime bulimia prevalence within men | 0.08 | percent | U.S. men ages 18+ | United States | Sex-specific population estimate; not a case-share denominator; overall N discrepancy described in M-30 | April 2012-June 2013 | 2018 | National probability household survey | survey disorder criteria | Not stated in source | Udo and Grilo, Biol Psychiatry 2018;84:345-354 | https://pmc.ncbi.nlm.nih.gov/articles/PMC6097933/ | Not stated in source | In 2012-2013 NESARC-III, weighted lifetime bulimia prevalence was 0.08% within U.S. men. This is not their share of all cases. | 2026-09-29 | Verified | Table 1 lifetime prevalence | Primary full text | Table 8A men 2012-2013 bulimia | Not stated in source | Underlying source rights retained; no third-party data license granted by TRT Provider Guide. | |
| M-65 | measurement | Lifetime binge-eating disorder prevalence within men | 0.42 | percent | U.S. men ages 18+ | United States | Sex-specific population estimate; not a case-share denominator; overall N discrepancy described in M-30 | April 2012-June 2013 | 2018 | National probability household survey | survey disorder criteria | Not stated in source | Udo and Grilo, Biol Psychiatry 2018;84:345-354 | https://pmc.ncbi.nlm.nih.gov/articles/PMC6097933/ | Not stated in source | In 2012-2013 NESARC-III, weighted lifetime binge-eating disorder prevalence was 0.42% within U.S. men. This is not their share of all cases. | 2026-09-29 | Verified | Table 1 lifetime prevalence | Primary full text | Table 8A men 2012-2013 binge-eating disorder | Not stated in source | Underlying source rights retained; no third-party data license granted by TRT Provider Guide. | |
| M-66 | measurement | Lifetime anorexia prevalence within women | 1.42 | percent | U.S. women ages 18+ | United States | Sex-specific population estimate; not a case-share denominator; overall N discrepancy described in M-30 | April 2012-June 2013 | 2018 | National probability household survey | survey disorder criteria | Not stated in source | Udo and Grilo, Biol Psychiatry 2018;84:345-354 | https://pmc.ncbi.nlm.nih.gov/articles/PMC6097933/ | Not stated in source | In 2012-2013 NESARC-III, weighted lifetime anorexia prevalence was 1.42% within U.S. women. This is not their share of all cases. | 2026-09-29 | Verified | Table 1 lifetime prevalence | Primary full text | Table 8A women 2012-2013 anorexia | Not stated in source | Underlying source rights retained; no third-party data license granted by TRT Provider Guide. | |
| M-67 | measurement | Lifetime bulimia prevalence within women | 0.46 | percent | U.S. women ages 18+ | United States | Sex-specific population estimate; not a case-share denominator; overall N discrepancy described in M-30 | April 2012-June 2013 | 2018 | National probability household survey | survey disorder criteria | Not stated in source | Udo and Grilo, Biol Psychiatry 2018;84:345-354 | https://pmc.ncbi.nlm.nih.gov/articles/PMC6097933/ | Not stated in source | In 2012-2013 NESARC-III, weighted lifetime bulimia prevalence was 0.46% within U.S. women. This is not their share of all cases. | 2026-09-29 | Verified | Table 1 lifetime prevalence | Primary full text | Table 8A women 2012-2013 bulimia | Not stated in source | Underlying source rights retained; no third-party data license granted by TRT Provider Guide. | |
| M-68 | measurement | Lifetime binge-eating disorder prevalence within women | 1.25 | percent | U.S. women ages 18+ | United States | Sex-specific population estimate; not a case-share denominator; overall N discrepancy described in M-30 | April 2012-June 2013 | 2018 | National probability household survey | survey disorder criteria | Not stated in source | Udo and Grilo, Biol Psychiatry 2018;84:345-354 | https://pmc.ncbi.nlm.nih.gov/articles/PMC6097933/ | Not stated in source | In 2012-2013 NESARC-III, weighted lifetime binge-eating disorder prevalence was 1.25% within U.S. women. This is not their share of all cases. | 2026-09-29 | Verified | Table 1 lifetime prevalence | Primary full text | Table 8A women 2012-2013 binge-eating disorder | Not stated in source | Underlying source rights retained; no third-party data license granted by TRT Provider Guide. | |
| M-69 | measurement | Male share of lifetime anorexia cases in help-seeking analysis | 7.5 | percent | NESARC-III adults with lifetime anorexia who answered help-seeking questions | United States | 23 men / 275 total cases unweighted; published percentage is weighted | April 2012-June 2013 | 2019 | National probability household survey, defined analysis subset | survey disorder criteria | Not stated in source | Coffino JA, Udo T, Grilo CM. Mayo Clin Proc. 2019;94(8); DOI 10.1016/j.mayocp.2019.02.030 | https://pmc.ncbi.nlm.nih.gov/articles/PMC6706865/ | Not stated in source | Men accounted for 7.5% of lifetime anorexia cases in Coffino and colleagues' weighted analysis of 2012-2013 U.S. national-survey respondents who answered help-seeking questions. The unweighted counts were 23 men among 275 cases; those counts do not reproduce the weighted percentage. | 2026-09-29 | Verified | Results: Distribution of ED diagnosis in Total Sample by Sex and Ethnicity/Race | Primary full text | Table 8B anorexia | Not stated in source | Underlying source rights retained; no third-party data license granted by TRT Provider Guide. | |
| M-70 | measurement | Male share of lifetime bulimia cases in help-seeking analysis | 14.1 | percent | NESARC-III adults with lifetime bulimia who answered help-seeking questions | United States | 12 men / 91 total cases unweighted; published percentage is weighted | April 2012-June 2013 | 2019 | National probability household survey, defined analysis subset | survey disorder criteria | Not stated in source | Coffino JA, Udo T, Grilo CM. Mayo Clin Proc. 2019;94(8); DOI 10.1016/j.mayocp.2019.02.030 | https://pmc.ncbi.nlm.nih.gov/articles/PMC6706865/ | Not stated in source | Men accounted for 14.1% of lifetime bulimia cases in Coffino and colleagues' weighted analysis of 2012-2013 U.S. national-survey respondents who answered help-seeking questions. The unweighted counts were 12 men among 91 cases; those counts do not reproduce the weighted percentage. | 2026-09-29 | Verified | Results: Distribution of ED diagnosis in Total Sample by Sex and Ethnicity/Race | Primary full text | Table 8B bulimia | Not stated in source | Underlying source rights retained; no third-party data license granted by TRT Provider Guide. | |
| M-71 | measurement | Past-year creatine use | 8.71 | percent | U.S. boys in grades 8, 10 and 12 | United States | 874,931 adolescents across all sexes and years in full study; male per-window n not verified | 2019-2020 | 2026 | National probability school survey, weighted | behaviors | Not stated in source | Veliz et al., Ann Epidemiol. 2026;120:110107 | https://www.sciencedirect.com/sdfe/pdf/download/eid/1-s2.0-S1047279726001055/first-page-pdf | Not stated in source | In 2019-2020, 8.71% of U.S. boys in grades 8, 10 and 12 reported past-year creatine use in weighted Monitoring the Future data analyzed by Veliz et al. (2026). | 2026-09-29 | Verified | Publisher public first page: Results | Original publisher public first page | Table 10 creatine 2019-2020 | Not stated in source | Underlying source rights retained; no third-party data license granted by TRT Provider Guide. | |
| M-72 | measurement | Past-year creatine use | 16.57 | percent | U.S. boys in grades 8, 10 and 12 | United States | 874,931 adolescents across all sexes and years in full study; male per-window n not verified | 2023-2024 | 2026 | National probability school survey, weighted | behaviors | Not stated in source | Veliz et al., Ann Epidemiol. 2026;120:110107 | https://www.sciencedirect.com/sdfe/pdf/download/eid/1-s2.0-S1047279726001055/first-page-pdf | Not stated in source | In 2023-2024, 16.57% of U.S. boys in grades 8, 10 and 12 reported past-year creatine use in weighted Monitoring the Future data analyzed by Veliz et al. (2026). | 2026-09-29 | Verified | Publisher public first page: Results | Original publisher public first page | Table 10 creatine 2023-2024 | Not stated in source | Underlying source rights retained; no third-party data license granted by TRT Provider Guide. | |
| M-73 | measurement | Past-year anabolic steroids use | 2.92 | percent | U.S. boys in grades 8, 10 and 12 | United States | 874,931 adolescents across all sexes and years in full study; male per-window n not verified | 2001-2002 | 2026 | National probability school survey, weighted | behaviors | Not stated in source | Veliz et al., Ann Epidemiol. 2026;120:110107 | https://www.sciencedirect.com/sdfe/pdf/download/eid/1-s2.0-S1047279726001055/first-page-pdf | Not stated in source | In 2001-2002, 2.92% of U.S. boys in grades 8, 10 and 12 reported past-year anabolic steroids use in weighted Monitoring the Future data analyzed by Veliz et al. (2026). | 2026-09-29 | Verified | Publisher public first page: Results | Original publisher public first page | Table 10 anabolic steroids 2001-2002 | Not stated in source | Underlying source rights retained; no third-party data license granted by TRT Provider Guide. | |
| M-74 | measurement | Past-year anabolic steroids use | 0.78 | percent | U.S. boys in grades 8, 10 and 12 | United States | 874,931 adolescents across all sexes and years in full study; male per-window n not verified | 2023-2024 | 2026 | National probability school survey, weighted | behaviors | Not stated in source | Veliz et al., Ann Epidemiol. 2026;120:110107 | https://www.sciencedirect.com/sdfe/pdf/download/eid/1-s2.0-S1047279726001055/first-page-pdf | Not stated in source | In 2023-2024, 0.78% of U.S. boys in grades 8, 10 and 12 reported past-year anabolic steroids use in weighted Monitoring the Future data analyzed by Veliz et al. (2026). | 2026-09-29 | Verified | Publisher public first page: Results | Original publisher public first page | Table 10 anabolic steroids 2023-2024 | Not stated in source | Underlying source rights retained; no third-party data license granted by TRT Provider Guide. | |
| M-75 | measurement | Male share of lifetime binge-eating disorder cases in help-seeking analysis | 26.7 | percent | NESARC-III adults with lifetime binge-eating disorder who answered help-seeking questions | United States | 62 men / 256 total cases unweighted; published percentage is weighted | April 2012-June 2013 | 2019 | National probability household survey, defined analysis subset | survey disorder criteria | Not stated in source | Coffino JA, Udo T, Grilo CM. Mayo Clin Proc. 2019;94(8); DOI 10.1016/j.mayocp.2019.02.030 | https://pmc.ncbi.nlm.nih.gov/articles/PMC6706865/ | Not stated in source | Men accounted for 26.7% of lifetime binge-eating disorder cases in Coffino and colleagues' weighted analysis of 2012-2013 U.S. national-survey respondents who answered help-seeking questions. The unweighted counts were 62 men among 256 cases; those counts do not reproduce the weighted percentage. | 2026-09-29 | Verified | Results: Distribution of ED diagnosis in Total Sample by Sex and Ethnicity/Race | Primary full text | Table 8B binge-eating disorder | Not stated in source | Underlying source rights retained; no third-party data license granted by TRT Provider Guide. | |
| M-76 | measurement | Tried to lose weight or intentionally lost 10+ pounds in past year | 40.5 | percent | U.S. men ages 20-39 | United States | Male item-specific n not stated in displayed table | 2013-2016 | 2018 | National probability survey, NHANES | behaviors | Not stated in source | CDC NCHS Data Brief 313 accompanying data table | https://www.cdc.gov/nchs/data/databriefs/db313_table.pdf | Not stated in source | In 2013-2016, 40.5% of U.S. men ages 20-39 had tried to lose weight or intentionally lost at least 10 pounds in the past year. This is an age-specific estimate, not an age-adjusted one. | 2026-09-29 | Verified age-specific estimate | Figure 2 table, male age-specific cells | Original CDC data table | Table 9 men 20-39 | Not stated in source | Underlying source rights retained; no third-party data license granted by TRT Provider Guide. | |
| M-77 | measurement | Tried to lose weight or intentionally lost 10+ pounds in past year | 44.1 | percent | U.S. men ages 40-59 | United States | Male item-specific n not stated in displayed table | 2013-2016 | 2018 | National probability survey, NHANES | behaviors | Not stated in source | CDC NCHS Data Brief 313 accompanying data table | https://www.cdc.gov/nchs/data/databriefs/db313_table.pdf | Not stated in source | In 2013-2016, 44.1% of U.S. men ages 40-59 had tried to lose weight or intentionally lost at least 10 pounds in the past year. This is an age-specific estimate, not an age-adjusted one. | 2026-09-29 | Verified age-specific estimate | Figure 2 table, male age-specific cells | Original CDC data table | Table 9 men 40-59 | Not stated in source | Underlying source rights retained; no third-party data license granted by TRT Provider Guide. | |
| M-78 | measurement | Tried to lose weight or intentionally lost 10+ pounds in past year | 39.9 | percent | U.S. men ages 60+ | United States | Male item-specific n not stated in displayed table | 2013-2016 | 2018 | National probability survey, NHANES | behaviors | Not stated in source | CDC NCHS Data Brief 313 accompanying data table | https://www.cdc.gov/nchs/data/databriefs/db313_table.pdf | Not stated in source | In 2013-2016, 39.9% of U.S. men ages 60+ had tried to lose weight or intentionally lost at least 10 pounds in the past year. This is an age-specific estimate, not an age-adjusted one. | 2026-09-29 | Verified age-specific estimate | Figure 2 table, male age-specific cells | Original CDC data table | Table 9 men 60+ | Not stated in source | Underlying source rights retained; no third-party data license granted by TRT Provider Guide. | |
| M-79 | measurement | Used protein powders or shakes | 34.7 | percent | Boys at 20 Minneapolis-St. Paul middle and high schools | United States, Minnesota | 1,307 boys in 2,793-student sample | 2009-2010 school year | 2012 | Local school sample | behaviors | Not stated in source | Eisenberg et al., Pediatrics. 2012;130:1019-1026 | https://pmc.ncbi.nlm.nih.gov/articles/PMC3507247/ | Not stated in source | In a 2009-2010 survey at 20 Twin Cities schools, 34.7% of boys reported they had used protein powders or shakes to increase muscle size or tone in the past year. | 2026-09-29 | Verified | Results; sex-specific prevalence | Primary full text | School-behavior subsection | Not stated in source | Underlying source rights retained; no third-party data license granted by TRT Provider Guide. | |
| M-80 | measurement | Used anabolic steroids | 5.9 | percent | Boys at 20 Minneapolis-St. Paul middle and high schools | United States, Minnesota | 1,307 boys in 2,793-student sample | 2009-2010 school year | 2012 | Local school sample | behaviors | Not stated in source | Eisenberg et al., Pediatrics. 2012;130:1019-1026 | https://pmc.ncbi.nlm.nih.gov/articles/PMC3507247/ | Not stated in source | In a 2009-2010 survey at 20 Twin Cities schools, 5.9% of boys reported they had used anabolic steroids to increase muscle size or tone in the past year. | 2026-09-29 | Verified | Results; sex-specific prevalence | Primary full text | School-behavior subsection | Not stated in source | Underlying source rights retained; no third-party data license granted by TRT Provider Guide. | |
| M-81 | measurement | Dissatisfied with muscle tone | 45 | percent | Male respondents in Psychology Today reader-questionnaire analysis | United States reader survey; not a national sample | 548 men in analyzed replies | 1996 questionnaire | 1997 | Volunteer magazine-reader sample | feelings | Not stated in source | Garner, Psychology Today, February 1, 1997 | https://www.psychologytoday.com/us/articles/199702/body-image-in-america-survey-results | Not stated in source | In Psychology Today's 1996 reader questionnaire, published in 1997, 45% of male respondents in the analysis were dissatisfied with muscle tone; overall-appearance dissatisfaction was 43%. | 2026-09-29 | Verified | Male dissatisfaction by body area | Original producer article | Table 1 row 1; source-tracing text | Not stated in source | Underlying source rights retained; no third-party data license granted by TRT Provider Guide. | |
| M-82 | measurement | Estimated anabolic steroid dependence | 1 | million people (approximate modeled estimate) | Americans in the historical model, principally male users | United States | Model based on prevalence datasets and dependence studies | Multiple historical datasets, not one survey wave | 2014 | Modeled estimate | behaviors | Not stated in source | Pope et al., Am J Addict. 2014;23:371-377 | https://pubmed.ncbi.nlm.nih.gov/24112239/ | Not stated in source | Pope and colleagues estimated in a paper published in 2014 that roughly one million Americans may have experienced anabolic-androgenic steroid dependence. This is a historical model, not a current count. | 2026-09-29 | Verified | Original Abstract Results | Original abstract | Adult steroid-use subsection | Not stated in source | Underlying source rights retained; no third-party data license granted by TRT Provider Guide. | |
| C-03 | calculation | Gap between 'very or fairly' and 'very' self-conscious men | 40 | percentage points | U.S. adult-citizen men | United States | 448 men unweighted | August 19-22, 2025 | 2026 | TRT Provider Guide calculation | derived comparison | Not stated in source | TRT Provider Guide | https://d3nkl3psvxxpe9.cloudfront.net/documents/Public_Nudity_poll_results.pdf | M-07 - M-01 = 59 - 19 = 40 percentage points | TRT Provider Guide's September 2026 calculation finds a 40-percentage-point gap between fairly-or-very (59%) and very-only (19%) appearance self-consciousness in YouGov's August 2025 poll of U.S. adult-citizen men. | 2026-09-29 | Reproducible | Self-consciousness question, printed p. 25 | Arithmetic from verified original table | Chart 1; Table 2 derived comparison | M-07,M-01 | Source: YouGov plc, 2025, © All rights reserved. https://yougov.com/en-us/about/terms/public-data-license; original-source link required; this compilation does not grant rights to underlying poll data. | |
| C-04 | calculation | Weight vs overall-appearance dissatisfaction among men | 2.0 | times | U.S. men in committed relationships in the 2016 Survey 2 main analysis | United States | 409 men in main analysis | 2016 | 2026 | TRT Provider Guide calculation | derived comparison | Not stated in source | TRT Provider Guide | https://www.academia.edu/99286244/The_Happy_American_Body_2_0_Predictors_of_affective_body_satisfaction_in_two_U_S_national_internet_panel_surveys | M-11 / M-09 = 36 / 18 = 2.0 | TRT Provider Guide calculated that weight dissatisfaction (36%) was twice overall-appearance dissatisfaction (18%) in the 2016 U.S. partnered-men sample published by Frederick and colleagues in 2020. | 2026-09-29 | Reproducible | Survey 2 main-sample satisfaction results | Arithmetic on rounded primary results | Table 3; Chart 3 | M-11,M-09 | Third-party source terms apply to underlying results; TRT Provider Guide credit covers original annotations and calculations only. | |
| C-05 | calculation | Men not satisfied with their body vs men dissatisfied | 39 vs 27 | percent | U.S. men in committed relationships in the 2016 Survey 2 main analysis | United States | Not stated in source | 2016 | 2026 | TRT Provider Guide calculation | derived comparison | Not stated in source | TRT Provider Guide | https://www.academia.edu/99286244/The_Happy_American_Body_2_0_Predictors_of_affective_body_satisfaction_in_two_U_S_national_internet_panel_surveys | 100 - M-44 = 39; 39 - M-10 = 12 | In the 2016 U.S. partnered-men sample, 61% were satisfied with their body, leaving 39% outside that category; only 27% were dissatisfied. The implied neutral group is about 12%, calculated from rounded source percentages by TRT Provider Guide. | 2026-09-29 | Reproducible | Survey 2; body satisfaction | Arithmetic on rounded primary results | Table 3 overall body | M-44,M-10 | Third-party source terms apply to underlying results; TRT Provider Guide credit covers original annotations and calculations only. | |
| C-07 | calculation | Change in teen boys' creatine and steroid use | Creatine x1.90 (2019-20 to 2023-24); steroids -73% (2001-02 to 2023-24) | ratio / percent | U.S. boys in grades 8, 10 and 12 | United States | Not stated in source | 2019-2020 to 2023-2024 creatine; 2001-2002 to 2023-2024 steroids | 2026 | TRT Provider Guide calculation | derived comparison | Not stated in source | TRT Provider Guide | https://www.sciencedirect.com/sdfe/pdf/download/eid/1-s2.0-S1047279726001055/first-page-pdf | 16.57/8.71 = 1.9024; (2.92-0.78)/2.92*100 = 73.2877% | TRT Provider Guide calculated that boys' past-year creatine use nearly doubled from 2019-2020 to 2023-2024 (8.71% to 16.57%); steroid use fell 73% over a different span, 2001-2002 to 2023-2024 (2.92% to 0.78%). | 2026-09-29 | Reproducible | Veliz first page Results | Arithmetic on primary published weighted estimates | Table 10; Chart 4 | M-71,M-72,M-73,M-74 | Third-party source terms apply to underlying results; TRT Provider Guide credit covers original annotations and calculations only. | |
| C-08 | calculation | Implied neutral share: Overall appearance | 15 | percent | U.S. men in committed relationships, Survey 2 main analysis | United States | 409 men main analysis | 2016 | 2026-09-29 | TRT Provider Guide calculation | derived comparison | Not stated in source | TRT Provider Guide calculation from Frederick et al. 2020 | https://www.academia.edu/99286244/The_Happy_American_Body_2_0_Predictors_of_affective_body_satisfaction_in_two_U_S_national_internet_panel_surveys | 100 - M-09 - M-43 = 100 - 18 - 67 = 15 | TRT Provider Guide calculated an implied neutral share of about 15% for overall appearance among men in the 2016 U.S. partnered-adult sample; this is 100 minus the rounded dissatisfied and satisfied shares. | 2026-09-29 | Recomputed; implied from rounded percentages | Survey 2 rounded satisfaction results | Arithmetic on rounded primary results | Table 3 Overall appearance neutral | M-09,M-43 | Underlying source rights retained; no third-party data license granted by TRT Provider Guide. | |
| C-09 | calculation | Implied neutral share: Overall body | 12 | percent | U.S. men in committed relationships, Survey 2 main analysis | United States | 409 men main analysis | 2016 | 2026-09-29 | TRT Provider Guide calculation | derived comparison | Not stated in source | TRT Provider Guide calculation from Frederick et al. 2020 | https://www.academia.edu/99286244/The_Happy_American_Body_2_0_Predictors_of_affective_body_satisfaction_in_two_U_S_national_internet_panel_surveys | 100 - M-10 - M-44 = 100 - 27 - 61 = 12 | TRT Provider Guide calculated an implied neutral share of about 12% for overall body among men in the 2016 U.S. partnered-adult sample; this is 100 minus the rounded dissatisfied and satisfied shares. | 2026-09-29 | Recomputed; implied from rounded percentages | Survey 2 rounded satisfaction results | Arithmetic on rounded primary results | Table 3 Overall body neutral | M-10,M-44 | Underlying source rights retained; no third-party data license granted by TRT Provider Guide. | |
| C-10 | calculation | Implied neutral share: Weight | 10 | percent | U.S. men in committed relationships, Survey 2 main analysis | United States | 409 men main analysis | 2016 | 2026-09-29 | TRT Provider Guide calculation | derived comparison | Not stated in source | TRT Provider Guide calculation from Frederick et al. 2020 | https://www.academia.edu/99286244/The_Happy_American_Body_2_0_Predictors_of_affective_body_satisfaction_in_two_U_S_national_internet_panel_surveys | 100 - M-11 - M-45 = 100 - 36 - 54 = 10 | TRT Provider Guide calculated an implied neutral share of about 10% for weight among men in the 2016 U.S. partnered-adult sample; this is 100 minus the rounded dissatisfied and satisfied shares. | 2026-09-29 | Recomputed; implied from rounded percentages | Survey 2 rounded satisfaction results | Arithmetic on rounded primary results | Table 3 Weight neutral | M-11,M-45 | Underlying source rights retained; no third-party data license granted by TRT Provider Guide. | |
| C-11 | calculation | Implied neutral share: Muscle tone/size | 17 | percent | U.S. men in committed relationships, Survey 2 main analysis | United States | 409 men main analysis | 2016 | 2026-09-29 | TRT Provider Guide calculation | derived comparison | Not stated in source | TRT Provider Guide calculation from Frederick et al. 2020 | https://www.academia.edu/99286244/The_Happy_American_Body_2_0_Predictors_of_affective_body_satisfaction_in_two_U_S_national_internet_panel_surveys | 100 - M-12 - M-46 = 100 - 27 - 56 = 17 | TRT Provider Guide calculated an implied neutral share of about 17% for muscle tone/size among men in the 2016 U.S. partnered-adult sample; this is 100 minus the rounded dissatisfied and satisfied shares. | 2026-09-29 | Recomputed; implied from rounded percentages | Survey 2 rounded satisfaction results | Arithmetic on rounded primary results | Table 3 Muscle tone/size neutral | M-12,M-46 | Underlying source rights retained; no third-party data license granted by TRT Provider Guide. | |
| C-12 | calculation | Started anabolic steroids at age 20 or older | 78 | percent | Steroid users in nine studies pooled by Pope et al. | Multiple samples | Nine pooled studies | Various historical study dates | 2026-09-29 | TRT Provider Guide calculation | derived comparison | Not stated in source | TRT Provider Guide calculation from Pope et al. 2014 | https://pubmed.ncbi.nlm.nih.gov/24112239/ | 100 - M-34 = 100 - 22 = 78 | From the pooled historical estimate that 22% started anabolic steroids before age 20, TRT Provider Guide calculated that about 78% started at 20 or older. | 2026-09-29 | Verified | Abstract age-at-first-use result | Arithmetic from original abstract | Adult steroid-use subsection | M-34 | Underlying source rights retained; no third-party data license granted by TRT Provider Guide. | |
| C-13 | calculation | Change in male weight-loss-attempt estimate | 6.7 | percentage points | U.S. men ages 20+ | United States | NHANES estimates; same definition | 2007-2008 to 2015-2016 | 2026-09-29 | TRT Provider Guide calculation | derived comparison | Not stated in source | TRT Provider Guide calculation from CDC MMWR | https://www.cdc.gov/mmwr/volumes/67/wr/mm6741a10.htm | 42.2 - 35.5 = 6.7 | TRT Provider Guide calculated a 6.7-percentage-point increase in the age-adjusted weight-loss-attempt estimate for U.S. men ages 20+ between 2007-2008 and 2015-2016 (35.5% to 42.2%). | 2026-09-29 | Verified | QuickStats endpoint values | Arithmetic from primary CDC report | Table 9 trend | M-27 | Underlying source rights retained; no third-party data license granted by TRT Provider Guide. | |
| C-14 | calculation | Probable muscle dysmorphia cases divided by sample | 2.8 | percent | Boys and men ages 15-35 recruited through social-media ads | Canada and United States | 41 probable cases / 1,488 participants | March-April 2024 | 2026-09-29 | TRT Provider Guide calculation | derived comparison | Not stated in source | TRT Provider Guide arithmetic check of Ganson et al. 2025 | https://pmc.ncbi.nlm.nih.gov/articles/PMC11916914/ | 41 / 1488 * 100 = 2.7554; rounded to one decimal = 2.8 | The 41 probable muscle-dysmorphia cases in 1,488 participants give 2.755%, rounding to the published 2.8%; the sample was not nationally representative. | 2026-09-29 | Verified | Primary Methods and Results | Recomputed from original counts | Table 7 probable MD | M-29 | Underlying source rights retained; no third-party data license granted by TRT Provider Guide. |
Source: Male Body Image Source Check CSV.
Blank CSV values appear as “Not stated in source.” Source-check status describes this editorial audit; it is not a clinical assessment.
Where did "tripled to 45%" come from?
The full trail was not established. Psychology Today's 1997 article reports 43% of men dissatisfied with their overall appearance and 45% dissatisfied with their muscle tone. Those are different measures, not competing estimates of the same thing. The article mentions earlier surveys in 1972 and 1985, but the inspected text does not verify the male 15% comparison point.
The bigger issue is who answered. The magazine printed a five-page questionnaire in its March/April 1996 issue. About 4,500 readers mailed it back. The analysis used the first 4,000, and only 548 of them were men. The article says the people who replied were mostly white, college-educated and in their early to mid-30s.
That's a real finding about readers who chose to write in. It is not a measure of all men, and the questionnaire was printed 30 years before this source check. Do not claim that the 43% finding proves where the separate 45% trend claim came from.
Where did "men are 1 in 4 eating-disorder cases" come from?
A 2001–2003 national survey found lifetime rates in men of 0.3% for anorexia, 0.5% for bulimia and 2.0% for binge-eating disorder. Women's rates were 0.9%, 1.5% and 3.5%.
Those percentages use men and women as separate denominators. They do not, by themselves, tell you men's share of all cases. Dividing the men's rate by the sum of the two rates silently assumes equal weighted populations of men and women. Adding the disorders also risks counting the same person more than once.
So the exact origin of a catch-all "1 in 4" claim remains unresolved here. A later paper directly reports weighted male case shares for a defined group: people with lifetime eating disorders who answered help-seeking questions. Use those published shares in the eating-disorder section, rather than making a case-share estimate from two prevalence rates.
Where did "42% of men with eating disorders are gay" come from?
It comes from a review of patient records at Massachusetts General Hospital. The records covered 135 men treated for eating disorders from 1980 to 1994. Among the 62 men with bulimia, 42% were identified as gay or bisexual.
That's one hospital, one diagnosis and records from 1980–1994. It says nothing about men with anorexia or binge-eating disorder, and nothing about men outside that hospital. Gay men do report more body dissatisfaction in large surveys. You'll find those numbers below.
Where did "1 in 10 gym-goers have bigorexia" come from?
In a 2015 BBC Newsbeat story, the chair of the Body Dysmorphic Disorder Foundation said about 10% of men in UK gyms may have muscle dysmorphia. The story cites no study.
Watch how the words changed as the number traveled. The original said men "may have" it. A South African news column that October said "at least" 1 in 10.
One measured result is 2.8% of boys and men aged 15–35 in a 2024 U.S.–Canada survey. That's a different group than gym-goers, so it doesn't prove the gym estimate wrong. It is a count of probable cases in that sample, not a clinical diagnosis rate.
How many men are self-conscious about their appearance?
In an August 2025 YouGov poll of U.S. adult citizens, 59% of men said they were fairly or very self-conscious about how their face and body look. Nineteen percent said they were very self-conscious. Among women, 70% said fairly or very.
Picture the poll results as 10 men at a cookout. About 6 represent the fairly-or-very group. About 2 of those 6 represent the "very" group. This illustrates the percentages; it does not predict the answers of a real group of friends.
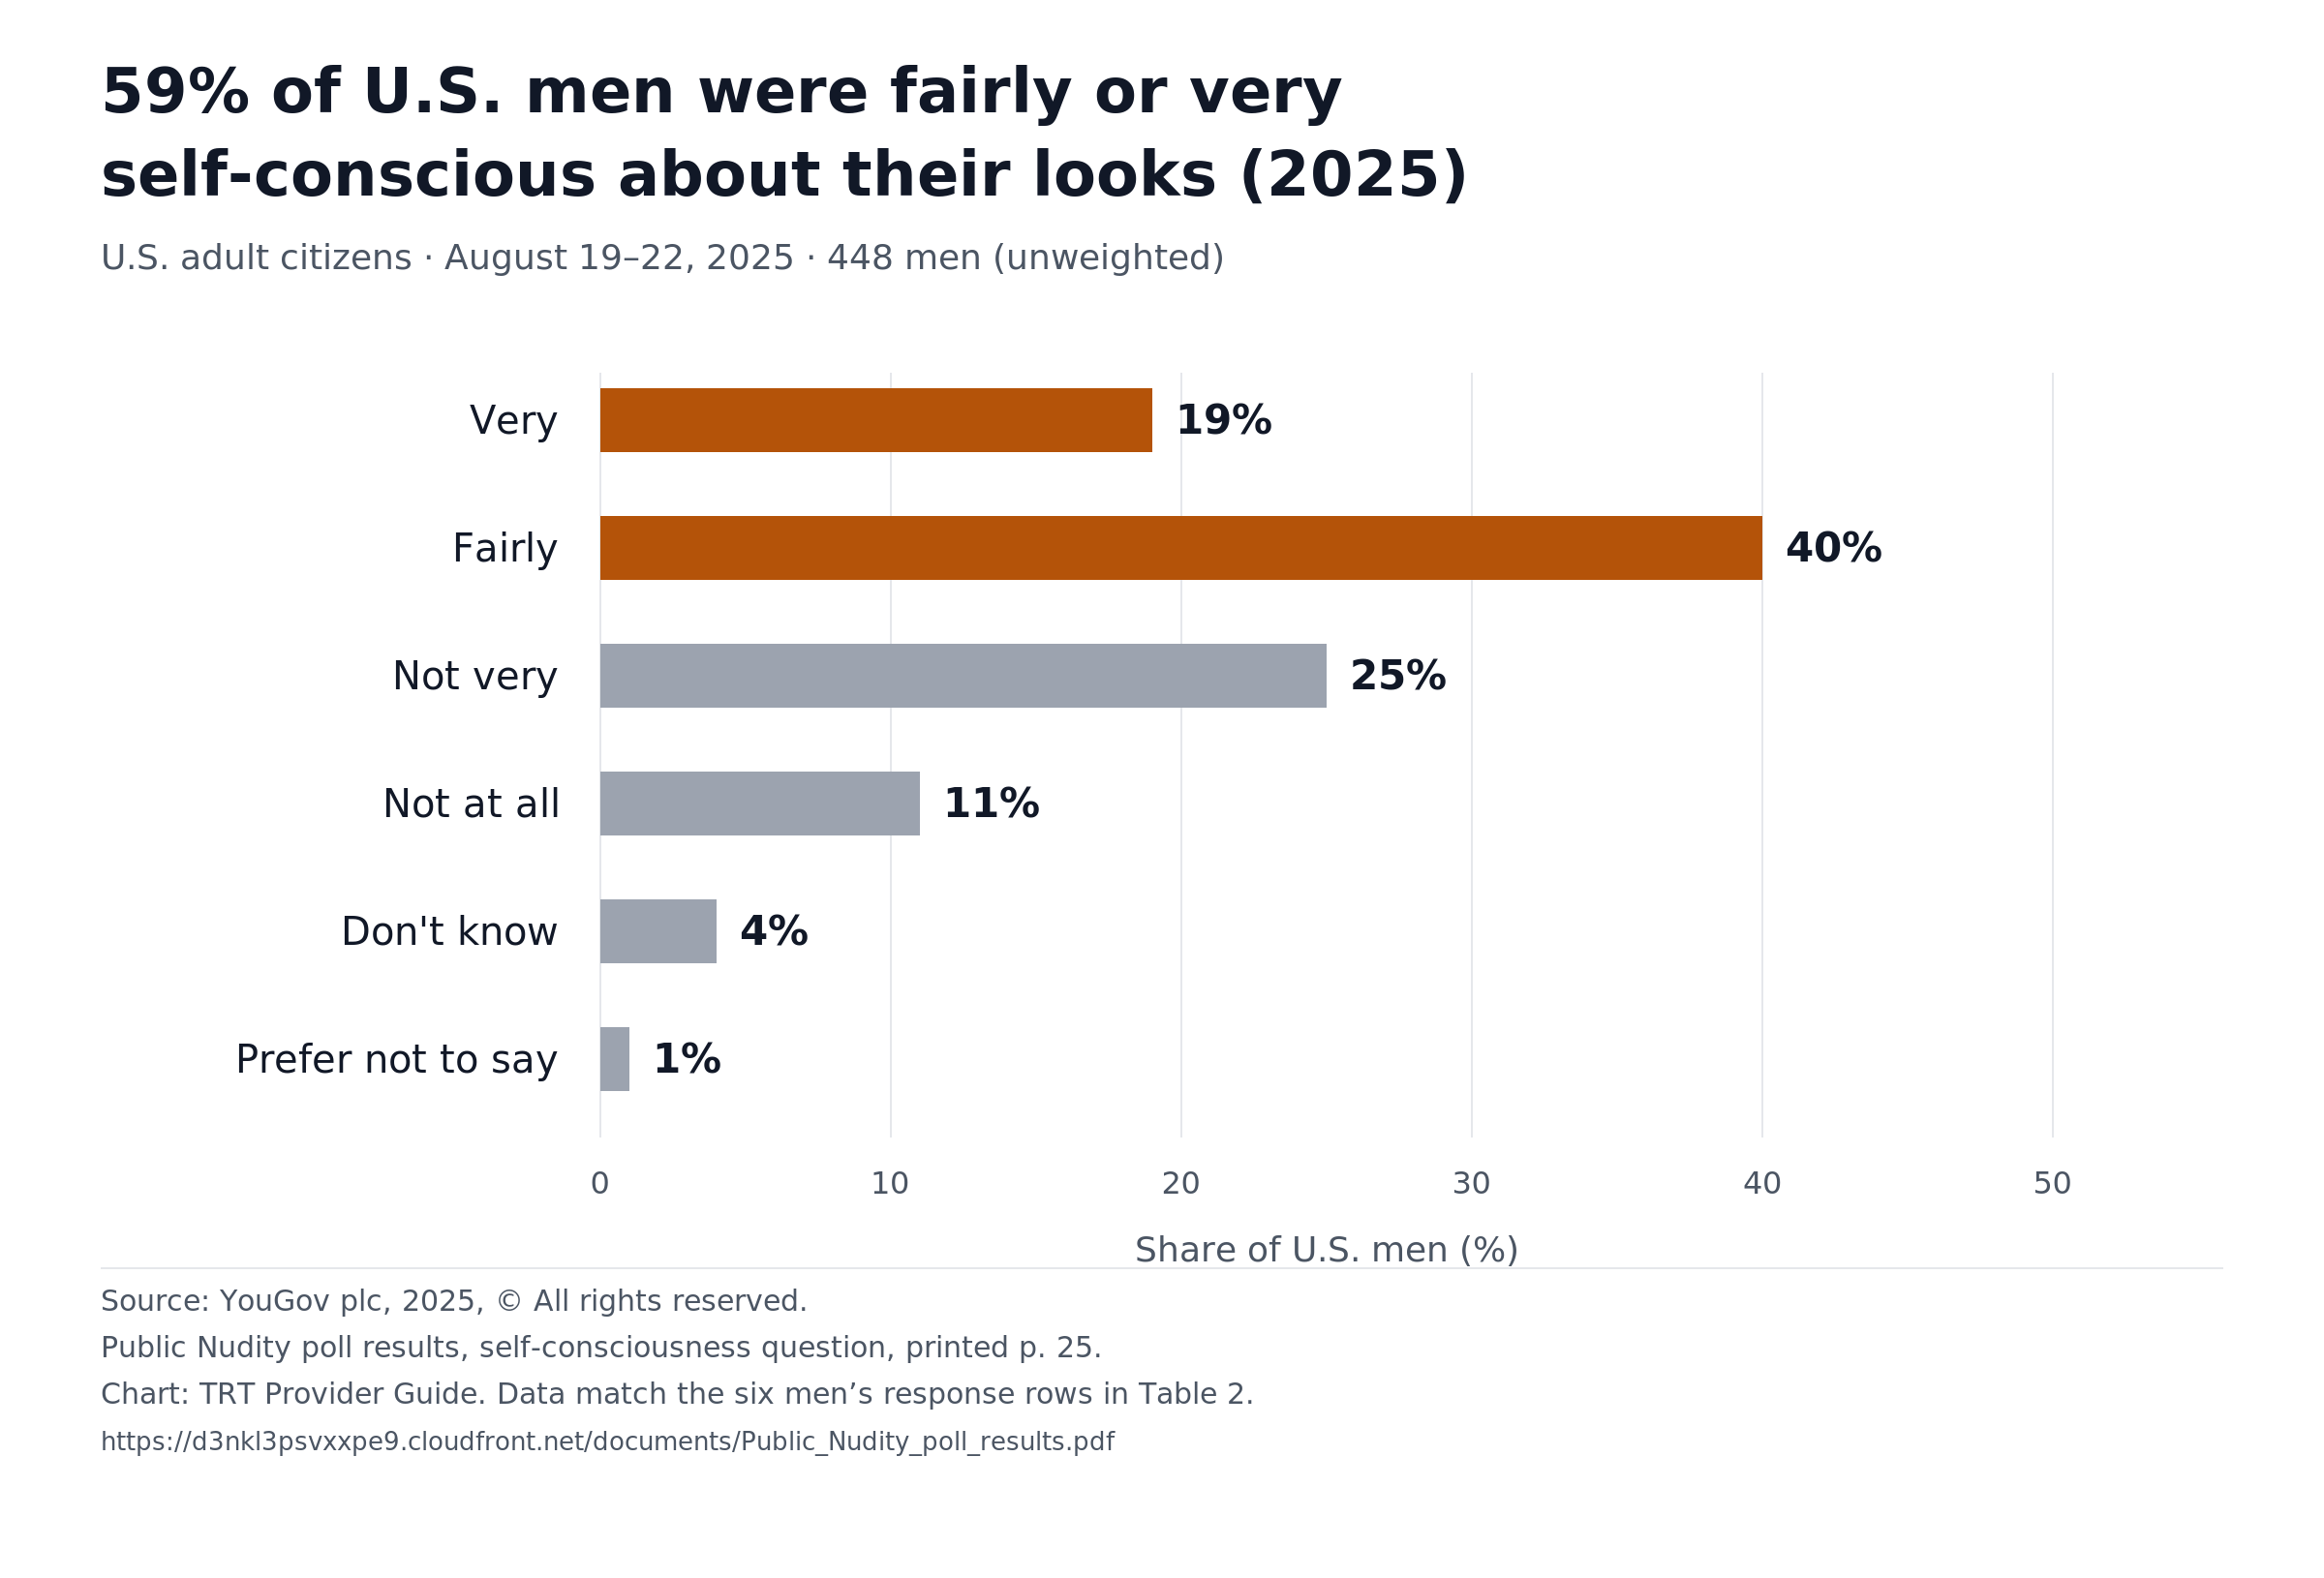
| Answer | Men | Women |
|---|---|---|
| Very self-conscious | 19% | 30% |
| Fairly self-conscious | 40% | 40% |
| Not very self-conscious | 25% | 17% |
| Not self-conscious at all | 11% | 7% |
| Don't know | 4% | 3% |
| Prefer not to say | 1% | 2% |
| Very or fairly (sum of the first two rows) | 59% | 70% |
Source: YouGov poll results, survey of 1,083 U.S. adult citizens (448 men, 635 women, unweighted), August 19–22, 2025. Women's column sums to 99% because of rounding.
Why do 59% and 19% both describe the same poll?
They use different cutoffs. "Very or fairly" gives 59%. "Very" alone gives 19%. That's a 40-point gap from the same men answering the same question.
So if you write "most men are very self-conscious," you've made a mistake. "Most men are at least fairly self-conscious" is what the poll found.
Who does this poll describe?
It describes U.S. adult citizens in YouGov's online panel. People sign up for that panel, and YouGov weights the answers to match the country by age, gender, race, education and voting history. YouGov reports a margin of error of ±4.2 percentage points for the full sample. It does not publish a separate margin for the 448 men in this table. Do not attach the full-sample margin to the men's result.
It also measures one feeling: self-consciousness. It doesn't measure dissatisfaction, and it doesn't measure any disorder.
Are men more unhappy with their weight than their overall looks?
Yes, in the same-sample comparison here. In 2016 survey data from U.S. adults in committed relationships, 36% of men were dissatisfied with their weight, compared with 18% for their overall appearance. That's twice the share. The paper was published in 2020.
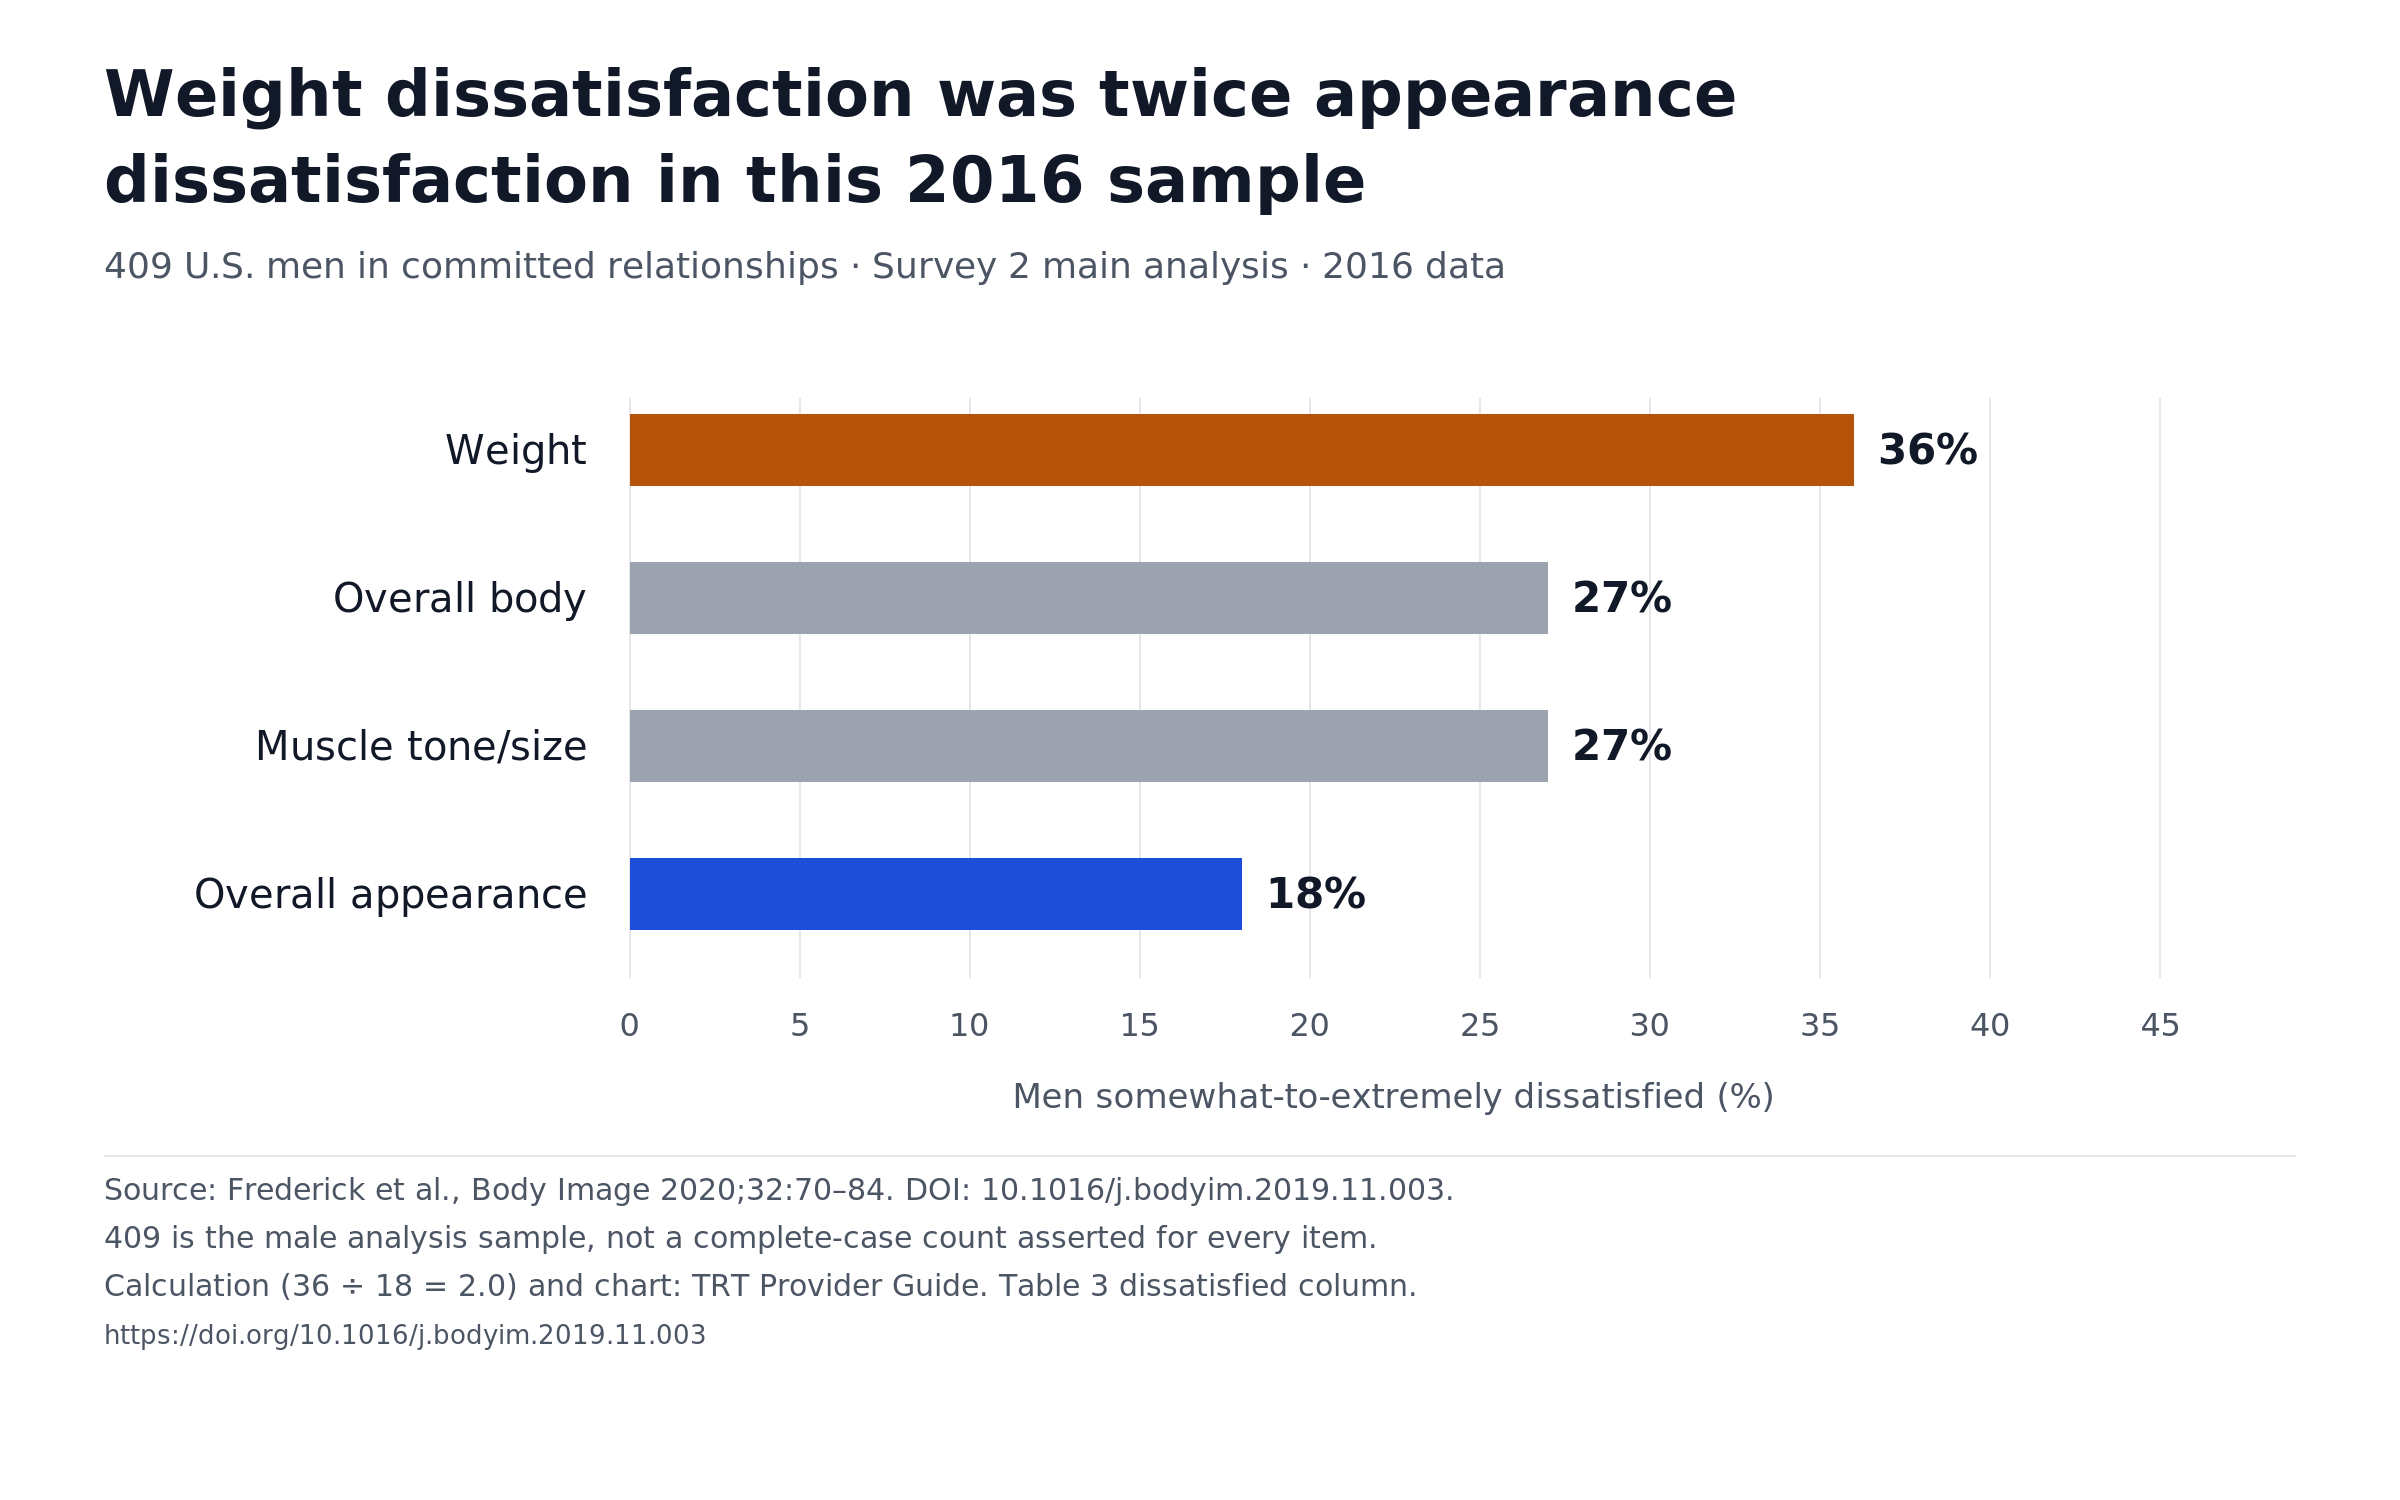
| Measure | Dissatisfied | Neutral | Satisfied |
|---|---|---|---|
| Weight | 36% | 10% | 54% |
| Overall body | 27% | 12% | 61% |
| Muscle tone/size | 27% | 17% | 56% |
| Overall appearance | 18% | 15% | 67% |
Source: Frederick et al., "The Happy American Body 2.0," Body Image, 2020; full-text methods and results. Survey 2 was collected in 2016. Its main analysis included 409 men and 590 women in committed relationships. The table shows men only. Dissatisfied and satisfied shares are published, rounded percentages. Each neutral share is implied by 100 minus those two percentages, calculated by TRT Provider Guide, and may differ from the unrounded survey result.
The same 2016 partnered-adult sample found 18% of men were very or extremely dissatisfied with at least one of these four things.
Does "not satisfied" mean "dissatisfied"?
No, and this mix-up is easy to make. In Table 3's 2016 partnered-adult sample, 61% of men were satisfied with their body. That leaves 39% who were not. But only 27% were dissatisfied. The implied middle group is about 12%, calculated from rounded percentages.
Calling all 39% "unhappy" would overstate it by about 12 percentage points.
Do gay and straight men answer differently?
Yes. In five large U.S. online surveys, gay men were more likely than straight men to be unhappy with their muscles and overall looks. The published percentages were closer for weight; the authors did not find a clear gay–straight difference for that measure.
| Dissatisfied with… | Straight men | Gay men |
|---|---|---|
| Muscle size/tone | 30% | 45% |
| Weight | 39% | 44% |
| Physical appearance | 21% | 29% |
Source: Frederick & Essayli, Psychology of Men & Masculinity, 2016; authors' institutional abstract. Across five U.S. internet studies, the authors analyzed 111,958 straight men and 4,398 gay men. Those combined counts are not the denominator for each table cell. Collection years and the row-specific sample sizes were not verified from the accessible abstract.
These are online-study findings, not one national probability-sample estimate. Keep the sexual-orientation groups and the unknown collection years attached when citing them.
How much pressure do men feel about their bodies?
In an April 2021 YouGov survey, 42% of U.S. males 16 and older said they felt completely or somewhat pressured to have a particular body type. Fifty-six percent said the media promotes a body image for men that can't be reached.
| Question and answer | Share of males |
|---|---|
| Feel completely under pressure to have a particular body type | 11% |
| Feel somewhat under pressure | 32% |
| Don't feel under too much pressure | 31% |
| Don't feel under pressure at all | 25% |
| Don't know (pressure question) | 2% |
| Media does promote an unattainable body image for men | 56% |
| Media does not | 32% |
| Don't know (media question) | 12% |
Source: YouGov Body Image Study 2021 and its data tables. Survey of 1,302 U.S. people aged 16 and older, including 653 males (unweighted), April 26–27, 2021. The pressure responses sum to 101% because the displayed cells are rounded.
One small wrinkle. YouGov's article says 42% of men felt pressure. The table cells add to 43% (11 + 32). Rounding could explain the difference, but the unrounded values were not available. We retain YouGov's published 42% and show the rounded cells rather than silently replacing it with 43%.
Some articles credit these numbers to a 2024 Brunel University of London study. The Brunel news release quotes the YouGov numbers. Brunel's own study surveyed 224 men in the UK, and it didn't produce these percentages.
Does social media cause body image problems in men?
The studies here can't prove that. They show links, not causes. Brunel's study of 224 physically active UK men found that more passive scrolling went along with more attention to appearance and a stronger drive for muscles. Men who liked and commented more were less satisfied with their bodies.
That's a link. It could run both ways. A man who already worries about his body might scroll fitness posts more.
What do UK male body image statistics show?
In a 2019 YouGov survey of 2,103 UK men for the Mental Health Foundation, 28% said body image had made them feel anxious and 25% said it had made them feel depressed. Separately, CALM reports that 48% of 2,000 men surveyed said body image had affected their mental wellbeing. The campaign was reported in 2021; its exact fieldwork dates are not published on the inspected producer page.
| Experience | Share of men | Time frame | Survey |
|---|---|---|---|
| Felt anxious because of body image | 28% | Not stated | MHF/YouGov 2019 |
| Felt depressed because of body image | 25% | Not stated | MHF/YouGov 2019 |
| Felt down or low because of body image | 25% | Last year | MHF/YouGov 2019 |
| Compared themselves negatively to others | 22% | Last year | MHF/YouGov 2019 |
| Dressed to hide parts of their body | 21% | Last year | MHF/YouGov 2019 |
| Felt shame because of body image | 15% | Last year | MHF/YouGov 2019 |
| Felt disgusted because of body image | 12% | Last year | MHF/YouGov 2019 |
| Had suicidal thoughts or feelings because of body image | 11% | Not stated | MHF/YouGov 2019 |
| Deliberately hurt themselves because of body image | 4% | Not stated | MHF/YouGov 2019 |
| Felt satisfied because of body image | 23% | Last year | MHF/YouGov 2019 |
| Body image affected their mental wellbeing | 48% | Not stated | CALM BodyTalks; campaign reported in 2021 |
Sources: Mental Health Foundation, men's findings and Body image in adulthood (YouGov online survey of 4,505 UK adults, including 2,103 men, March 25–26, 2019); CALM BodyTalks. The BBC's April 28, 2021 report describes the CALM sample as UK males ages 16–40; the producer page confirms 48% and 2,000 men but does not supply those sampling details. These are different questions, and some come from different surveys, so don't add the rows. Self-reported anxiety and depression here are not clinical diagnoses.
If body image is weighing on you. You're not the only one, and it can get better with help. In the U.S., the National Alliance for Eating Disorders runs a helpline staffed by therapists at (866) 662-1235, Monday to Friday, 9 a.m. to 7 p.m. Eastern (listed as EST). The ANAD helpline is (888) 375-7767, Monday to Friday, 9 a.m. to 9 p.m. Central (listed as CST). If you're in crisis or thinking about suicide, call or text 988, or chat with the 988 Lifeline, any time.
How common are body dysmorphic disorder and muscle dysmorphia in men?
A 2004 U.S. telephone survey found 2.2% of men completing its module met criteria for body dysmorphic disorder. A 2024 online survey of boys and men aged 15–35 in Canada and the U.S. found 2.8% met criteria for probable muscle dysmorphia. Neither figure is a current, clinician-confirmed national diagnosis rate.
Body dysmorphic disorder is a mental health condition. A person gets stuck on a flaw in their looks that others barely notice, or can't see at all, and it causes real distress. Muscle dysmorphia is a form of it. The worry is that your body is too small or not muscular enough. The International OCD Foundation's expert guide also describes a link with anabolic steroid use.
Here's the scale within that sample: 41 of 1,488 met the criteria—about 1 in 36. This does not predict the rate in a new group of boys and men.
| What was measured | Men | Who and when | Source |
|---|---|---|---|
| Fairly or very self-conscious about appearance | 59% | U.S. adult citizens, 2025 | YouGov |
| Dissatisfied with weight | 36% | U.S. men in committed relationships, 2016 data | Frederick et al. |
| Ate more or differently, used supplements or used steroids to bulk up | 22% | U.S. men 18–24, 2001–2002 | Nagata et al. |
| Probable muscle dysmorphia | 2.8% | Boys and men 15–35, Canada and U.S., 2024 | Ganson et al. |
| Met criteria for body dysmorphic disorder | 2.2% | U.S. adults, 2004 | Koran et al. |
| Ever had binge-eating disorder | 0.42% | U.S. adults, 2012–2013 | Udo & Grilo |
| Ever had anorexia | 0.12% | U.S. adults, 2012–2013 | Udo & Grilo |
Sources: YouGov; Frederick et al.; Nagata et al.; Ganson et al.; Koran et al.; Udo & Grilo
These rows use different questions and populations; the last two share one survey. They are not stages of one condition and cannot be compared as if they came from the same group.
What is bigorexia?
"Bigorexia" is a nickname for muscle dysmorphia. It's not a separate diagnosis. Wanting to build muscle isn't bigorexia. The condition is about distress and a stuck belief that you're too small, even when you aren't.
How reliable are these disorder numbers?
Both have limits. The 2004 survey used trained interviewers who weren't clinicians, and its authors called for a follow-up using clinical interviews. Its sample also had more women and more people over 55 than the U.S. adult population.
The 2024 survey recruited its 1,488 boys and men through Instagram and Snapchat ads in March and April. People who answer those ads may differ from people who don't. Its probable-case estimate was 2.8%, with a reported 95% confidence interval of 2.0%–3.7%; that interval does not remove the limits of a self-selected sample.
What share of people with eating disorders are men?
In an analysis of 2012–2013 U.S. national-survey data, men were 7.5% of lifetime anorexia cases, 14.1% of bulimia cases and 26.7% of binge-eating disorder cases. Coffino and colleagues published those weighted shares for people who met the study's criteria and answered help-seeking questions. That is a defined sample, not one percentage for everyone with any eating disorder.
| Disorder | Men, 2001–2003 | Women, 2001–2003 | Men, 2012–2013 | Women, 2012–2013 |
|---|---|---|---|---|
| Anorexia | 0.3% | 0.9% | 0.12% | 1.42% |
| Bulimia | 0.5% | 1.5% | 0.08% | 0.46% |
| Binge-eating disorder | 2.0% | 3.5% | 0.42% | 1.25% |
Sources: Hudson et al., 2007 (NCS-R, February 2001–December 2003; eating-disorder module: 2,980 adults); Udo & Grilo, 2018 (NESARC-III, April 2012–June 2013), Table 1. Each cell is a weighted prevalence estimate within men or within women. It is not men's share of all cases.
| Disorder | Men's share of cases, weighted | Men / all cases, unweighted |
|---|---|---|
| Anorexia | 7.5% | 23 / 275 |
| Bulimia | 14.1% | 12 / 91 |
| Binge-eating disorder | 26.7% | 62 / 256 |
Source: Coffino, Udo & Grilo, 2019, Results: distribution of diagnoses by sex. These are 2012–2013 NESARC-III respondents with lifetime disorders who answered help-seeking questions. The weighted shares are reported by the authors; dividing the raw counts will not reproduce them. This subset is not identical to Udo & Grilo's full prevalence analysis above.
Two big cautions. The surveys used different interviews and different editions of the psychiatric manual (DSM-IV vs. DSM-5). And the newer survey's authors said they were surprised bulimia and binge-eating rates came in lower than earlier estimates, since DSM-5 had loosened some criteria. So show both numbers and don't declare a winner. A difference between these studies is not proof of a change over time.
One more gap: in the 2012–2013 survey, men with binge-eating disorder were less likely than women to ever seek help.
How many men and boys try to change their bodies?
In 2013–2016, the age-adjusted estimate of U.S. men 20 and older who tried to lose weight in the past year was 41.7%. Among U.S. men aged 18–24 in 2001–2002, 22% reported eating more or differently, using supplements or using steroids to gain weight or bulk up.
| Group | Share | Years |
|---|---|---|
| Men 20 and older | 41.7% | 2013–2016 |
| Men 20–39 | 40.5% | 2013–2016 |
| Men 40–59 | 44.1% | 2013–2016 |
| Men 60 and older | 39.9% | 2013–2016 |
| Men 20 and older (trend series) | 35.5% → 42.2% | 2007–2008 → 2015–2016 |
Sources: CDC NCHS Data Brief 313 and its data table; CDC MMWR QuickStats, 2018. The overall and trend figures are age-adjusted; the three age-group figures are age-specific. All use the National Health and Nutrition Examination Survey and count either trying to lose weight in the past year or losing at least 10 pounds on purpose. The pooled 2013–2016 estimate and the two-year trend endpoints cover different windows, not different definitions.
Losing weight can be a healthy goal. These numbers show how many men are working on their bodies, not how many are unhappy.
Are teen boys using more steroids?
Through 2023–2024, no. Past-year steroid use among U.S. boys in grades 8, 10 and 12 fell from 2.92% in 2001–2002 to 0.78% in 2023–2024. That's a drop of about three-quarters. But creatine use jumped. It went from 8.71% of teen boys in 2019–2020 to 16.57% in 2023–2024. That's close to double in four years.
| Substance | Earlier estimate | Earlier period | Later estimate | Later period |
|---|---|---|---|---|
| Creatine | 8.71% | 2019–2020 | 16.57% | 2023–2024 |
| Anabolic steroids | 2.92% | 2001–2002 | 0.78% | 2023–2024 |
Source: Veliz et al., primary paper; public first page, Methods and Results. These are weighted survey estimates, not counts inferred from the total study sample.
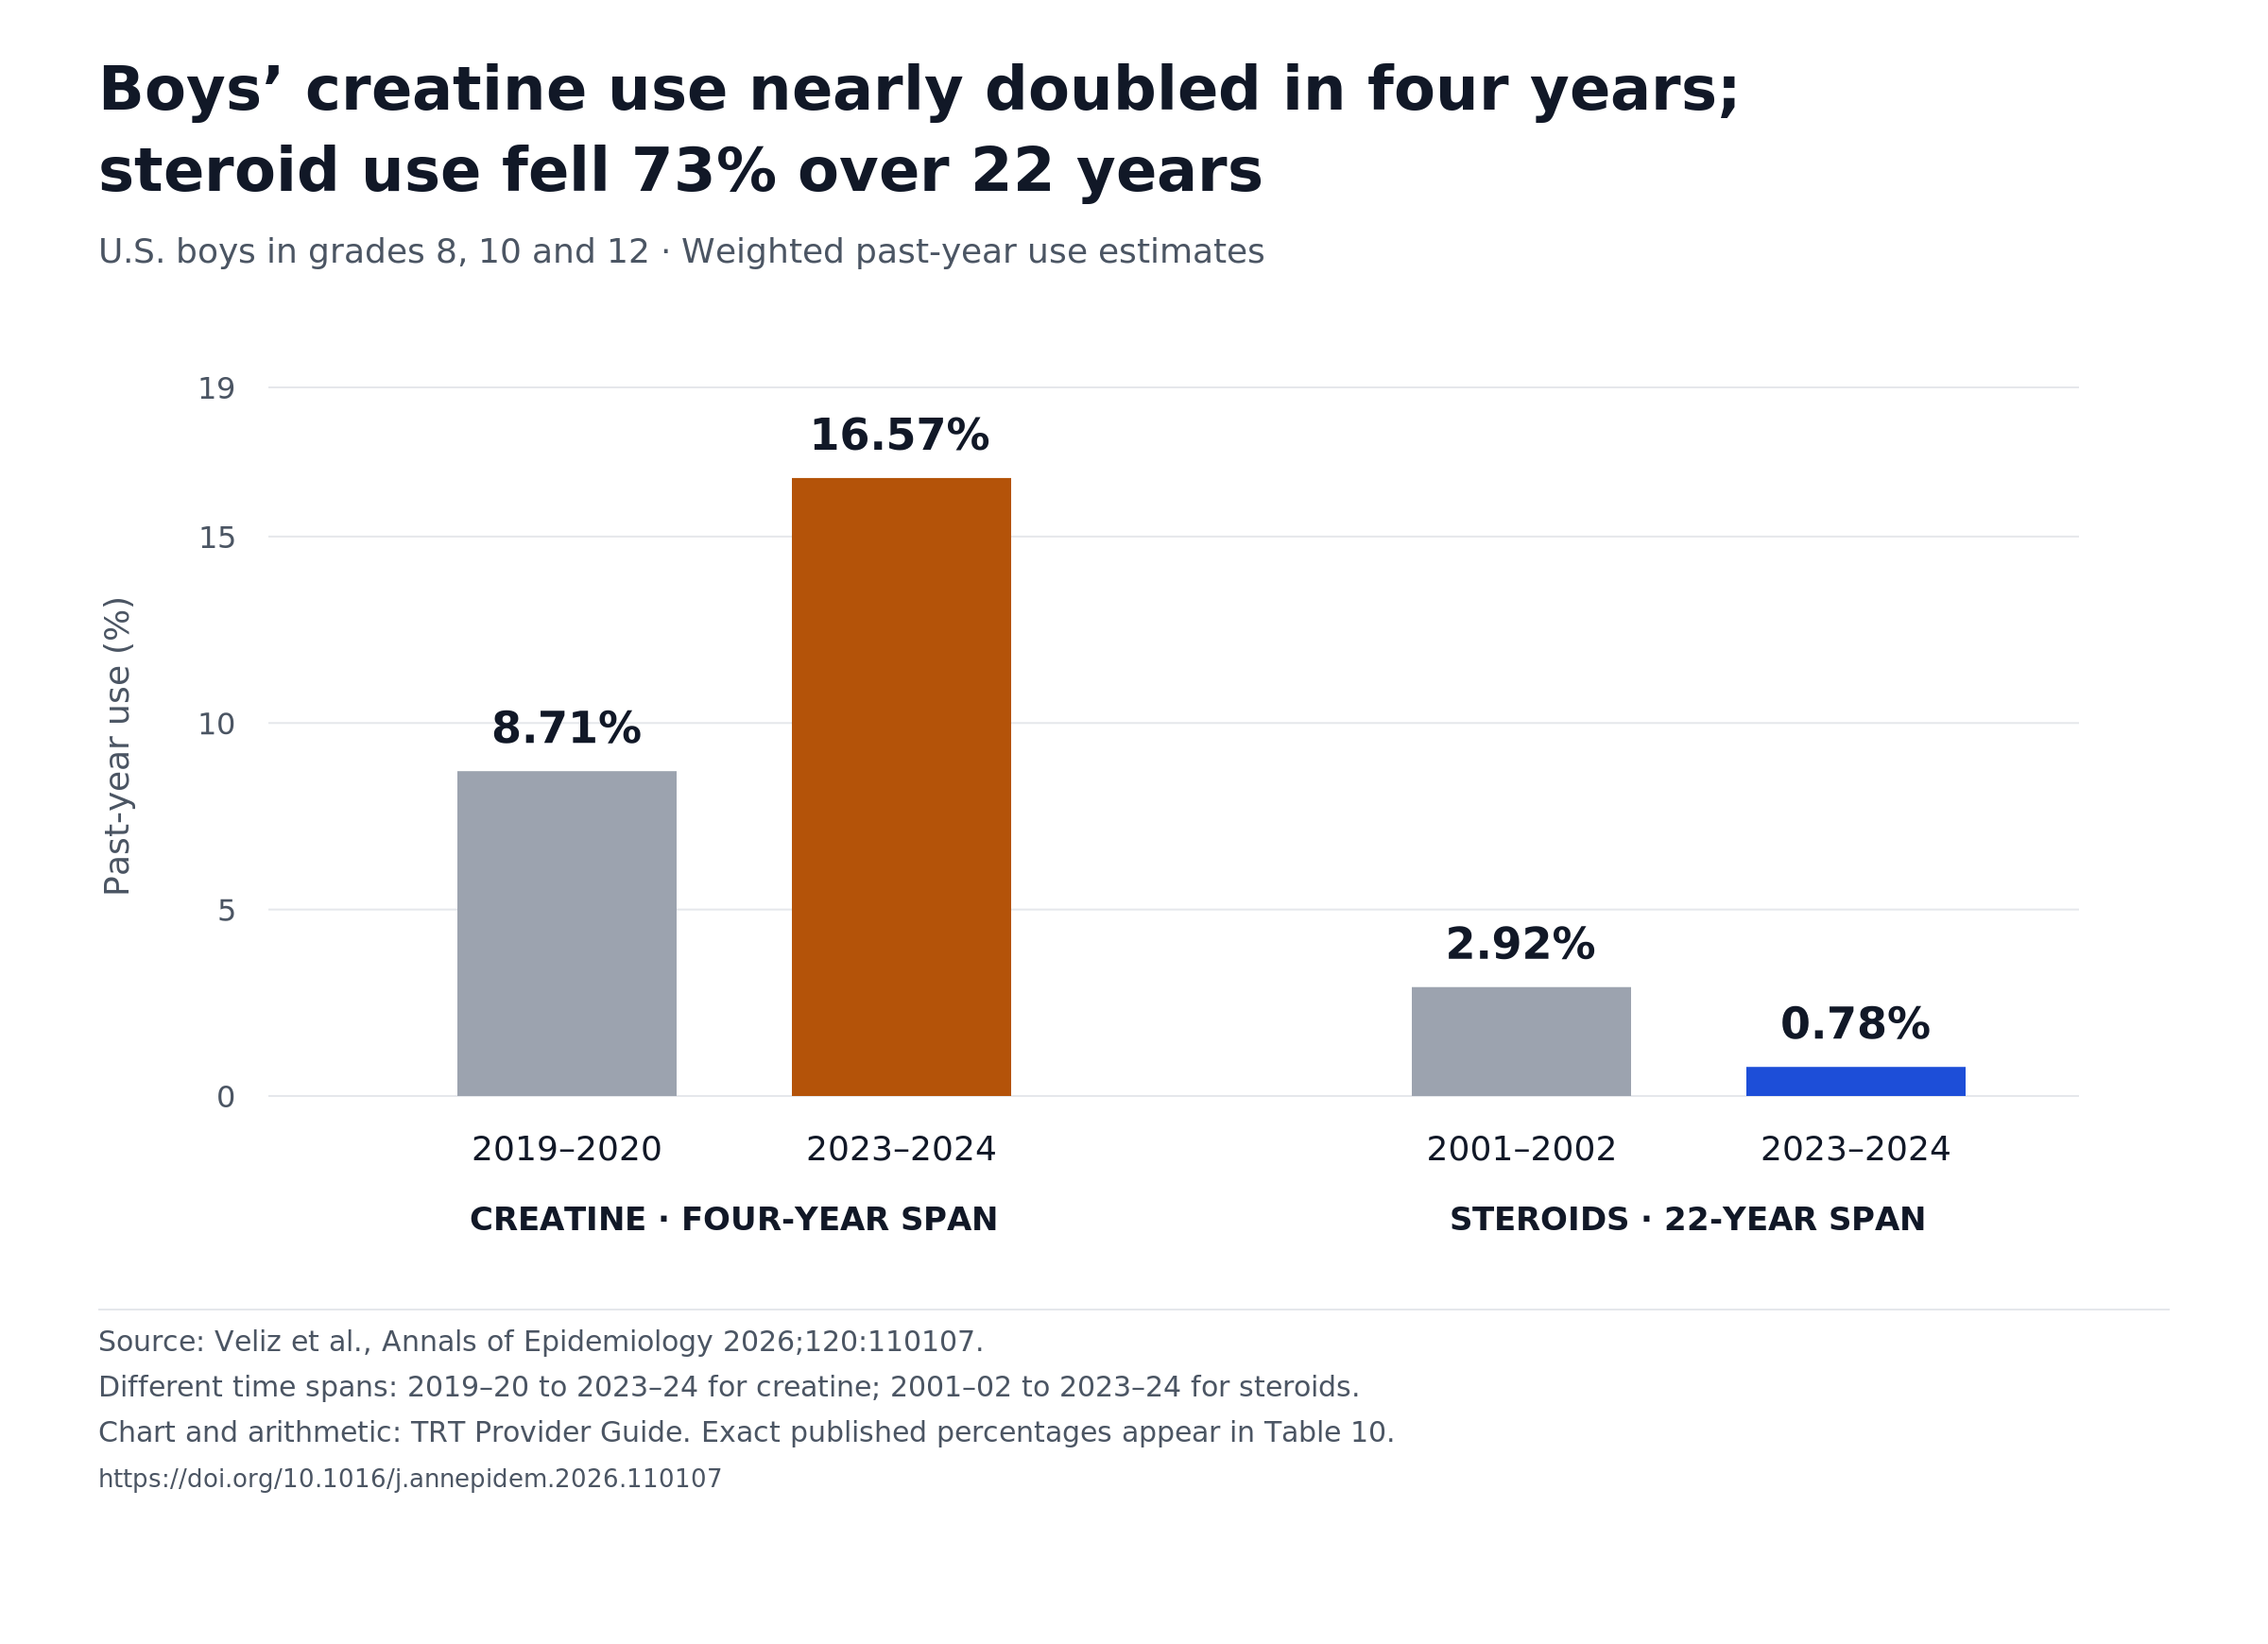
Source: Veliz et al., Annals of Epidemiology, 2026. The study used Monitoring the Future surveys of 874,931 8th, 10th and 12th graders from 2001 to 2024. That is the whole study sample, not the number of boys behind each estimate. Math: 16.57 ÷ 8.71 = 1.90; (2.92 − 0.78) ÷ 2.92 × 100 = 73.3%, rounded to 73%.
Creatine is not an anabolic steroid. Still, the researchers' paper notes that pediatric guidance recommends against its use under age 18 because evidence on safety and effectiveness in youth is limited.
How many American men have used anabolic steroids?
A paper published in 2014 estimated that 2.9 to 4.0 million Americans aged 13–50 had used anabolic steroids, and about 1 million may have become dependent. That modeled total includes women; it is not a male-only count or a 2026 estimate. Across nine studies pooled in the paper, 22% of users had started before age 20.
That last number matters. It means about 78% in those pooled studies had started at 20 or older. School surveys catch the teen years, so they miss most of the story.
You may also see "6.4% of men" used as a steroid figure. That comes from Sagoe and colleagues' 2014 review of 187 studies worldwide. It is a pooled estimate, not a representative count of all men in the world. A later medical review pointed out that it leans heavily on high-risk groups like athletes, gym members and prisoners. So it isn't a rate for men in general.
Both things can be true at once. Teen use can fall while millions of adults have used steroids at some point.
What about the "90% of teen boys" number?
It's real, but narrow. In the 2009–2010 school year, more than 90% of boys at 20 Minneapolis–St. Paul middle and high schools said they exercised more to build muscle. The same survey found 34.7% of boys used protein powders or shakes, and 5.9% of boys said they had used steroids in the past year. The sample included 1,307 boys and 1,486 girls. The exercise figure includes doing it rarely, sometimes or often; it does not measure compulsive exercise. It's one metro area, using 2009–2010 data.
Is male body image getting worse?
The selected sources here do not provide one like-for-like national trend in men's body dissatisfaction. The trend data that do exist point in different directions. More U.S. men tried to lose weight in 2015–2016 than in 2007–2008. Teen boys' steroid use has fallen, while their creatine use nearly doubled from 2019–2020 to 2023–2024.
It's tempting to line up Psychology Today's 43% from its 1996 questionnaire, published in 1997, against YouGov's 59% from 2025 and call it a rise. Don't. They asked different people different questions. One asked magazine readers about dissatisfaction. The other asked a weighted national panel about self-consciousness.
The difference is not just the year. A satisfaction rating, a weight-change behavior and a disorder assessment measure different things. This Source Check keeps them apart rather than treating changes between their percentages as a trend.
Does body image worry mean a man has low testosterone?
No. None of the numbers on this page can tell whether a man has low testosterone. Doctors diagnose low testosterone using symptoms or signs plus consistently low levels on repeat early-morning blood tests, as described in the AUA and Endocrine Society guidelines.
Feeling unhappy with your muscles does not establish low testosterone. To see how that diagnosis works, read who qualifies for testosterone therapy and which blood tests doctors use. Our low testosterone statistics page explains the guideline rules in detail.
Nonmedical anabolic steroid use and medically prescribed testosterone differ in purpose and clinical oversight, not in being wholly separate kinds of hormone. Both can suppress the body's own hormone signals and sperm production; prescribed TRT is not fertility-neutral. See the medical review and Endocrine Society guideline. For what the research says about recovery, see sperm recovery after testosterone. For the legal side, see is testosterone a controlled substance.
If worries about how you look take up a lot of your day, or get in the way of work, school or relationships, talk with a doctor or a mental health professional. That's the right first step, whatever your hormone levels are.
How we built this
What we collected. On September 29, 2026, we checked the sources behind 10 selected claims in this reference, then recorded related survey results and calculations. This is a source check, not a new survey or a systematic review of every study.
What counts as a selected claim. The 10 claims are the rows in Table 1. They are not ranked by how often websites repeat them. When a source trail stops, the row says so instead of supplying a guessed original study.
How we traced. For each number, we followed the trail to where it was first measured or said. We recorded who was asked, how many, where, when the data were collected, when it was published and what kind of sample it used.
How we added newer data. We looked for original sources that answer related questions: YouGov polls, federal surveys (NHANES and Monitoring the Future), national eating-disorder surveys and recent peer-reviewed studies. "Newer" does not mean the same question or population, and this selection does not establish that no later study exists.
What we calculated. Every calculation is shown next to its number and in the CSV:
- 19 + 40 = 59; 59 − 19 = 40 percentage points.
- 36 ÷ 18 = 2.0, within the 2016 partnered-men sample.
- 100 − 61 = 39; 39 − 27 = 12. Neutral percentages use rounded published inputs.
- 16.57 ÷ 8.71 = 1.90; (2.92 − 0.78) ÷ 2.92 × 100 = 73.3%, rounded to 73%.
- 100 − 22 = 78, for age of first steroid use in the pooled studies.
- 42.2 − 35.5 = 6.7 percentage points.
- 41 ÷ 1,488 × 100 = 2.76%, which rounds to the paper's 2.8% probable muscle-dysmorphia figure.
These are arithmetic on published results, not a new analysis of individual survey responses. We did not calculate men's case shares from sex-specific prevalence rates. Table 8B uses the weighted shares directly reported by Coffino and colleagues.
How closely we checked. We read the original tables for both YouGov polls and the original Psychology Today article. For CDC figures, we used the NCHS data brief, its data table and the MMWR report. We checked the Frederick 2020 paper's full-text methods and results to confirm the 2016 data and the main partnered-adult sample. We read the relevant full-text methods and results for Hudson, Udo and Grilo, Coffino, Eisenberg, Nagata and Ganson. The Veliz teen-use figures were checked against the publisher's public first-page Methods and Results, not just its news coverage; the rest of that paper was not fully accessible.
For Frederick and Essayli's five-study comparison, Carlat's clinical series, Koran's telephone survey, Pope's estimates and Sagoe's meta-analysis, verification was limited to the relevant original abstract or accessible publisher sections. Unknown collection years or row-specific denominators remain marked unknown. CALM's producer page confirms the 48% result and 2,000 men; the BBC supplies the campaign date and reported UK/age context. Other CALM percentages found only in secondary reports are not presented as verified measurements here. Each CSV row records its source and verification depth. Our site's research data methods and editorial standards apply.
How to repeat it. Download the CSV. Every row has the source link, the value, the years and the math. Calculation rows identify their inputs. A source-check row and a measurement row may describe the same finding; record counts are not counts of independent studies or participants.
What this data does and doesn't show
It does show where selected male body image numbers come from, where a trail remains incomplete, how old the verified data are, and who was asked. It also gives you newer numbers for related questions.
It doesn't show one current national rate for every kind of body-image concern, or a like-for-like trend across the different surveys. It doesn't show that social media causes body image problems. It can't diagnose anyone, and it can't tell anyone whether they need treatment.
Keep these rules in mind:
- Numbers from different surveys, years or countries can't be added or averaged into one figure.
- Weighted online panels (like YouGov's) are adjusted to look like the population, but people choose to join them.
- "Self-conscious," "dissatisfied" and "diagnosed" are three different things.
How to cite this page
Ready to copy:
TRT Provider Guide. "Male Body Image Statistics: 59% of U.S. Men Were Self-Conscious in 2025." TRT Provider Guide Research, updated September 2026; sources checked September 29, 2026. https://trtproviderguide.com/research/male-body-image-statistics/
When you quote a survey number, credit the group that ran the survey too. For example: "59% of U.S. adult-citizen men were fairly or very self-conscious about their appearance (YouGov, August 2025)." Original table. When you use our tracing or calculations, credit TRT Provider Guide.
Reuse: You may reuse our original text, source-check notes, calculations and chart design with credit to TRT Provider Guide; no link to this site is required. This permission does not license third-party data or images. Keep each original source credit and follow its terms, including YouGov's Public Data License and its required original-source link. YouGov source credit: "Source: YouGov plc, 2025, © All rights reserved" (2021 for the older poll).
Download the data
- Source Check dataset (CSV): male-body-image-source-check-2026-09-29.csv. 103 records: 10 claim checks, 82 measurements or published summaries, and 11 calculations, with source details and check dates. Some records describe the same finding; these are not 103 independent studies.
- Chart data (CSV): male-body-image-chart-data.csv
- Charts (PNG and SVG): Chart 1, Chart 2, Chart 3, Chart 4
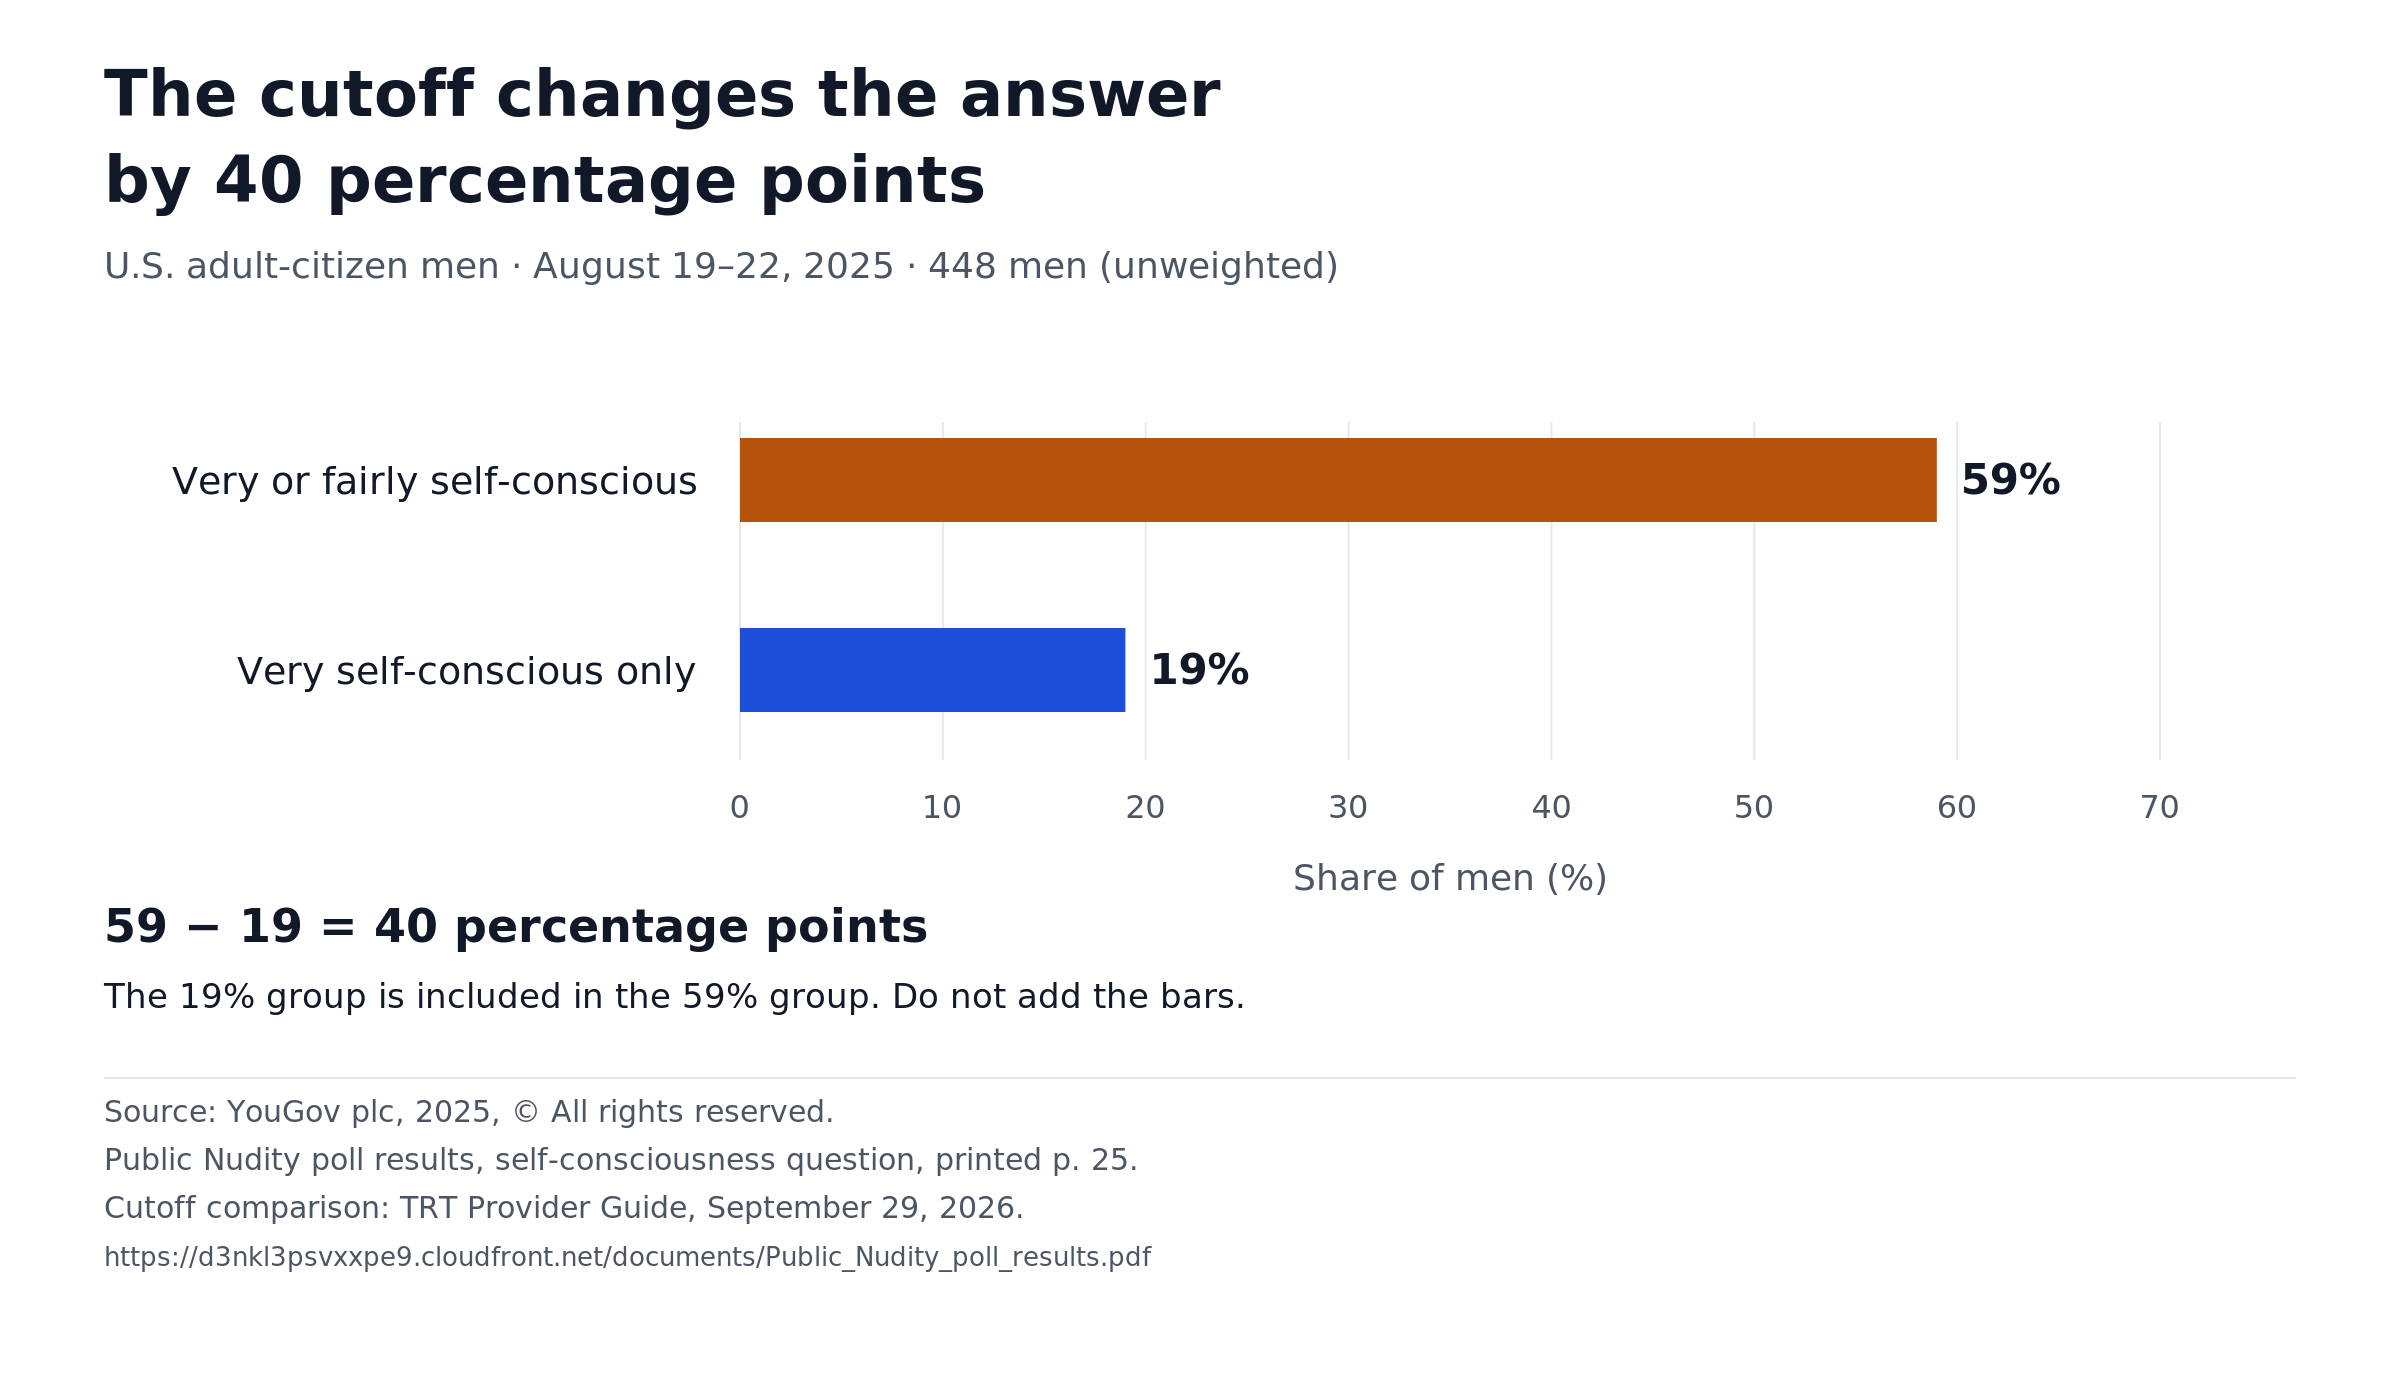
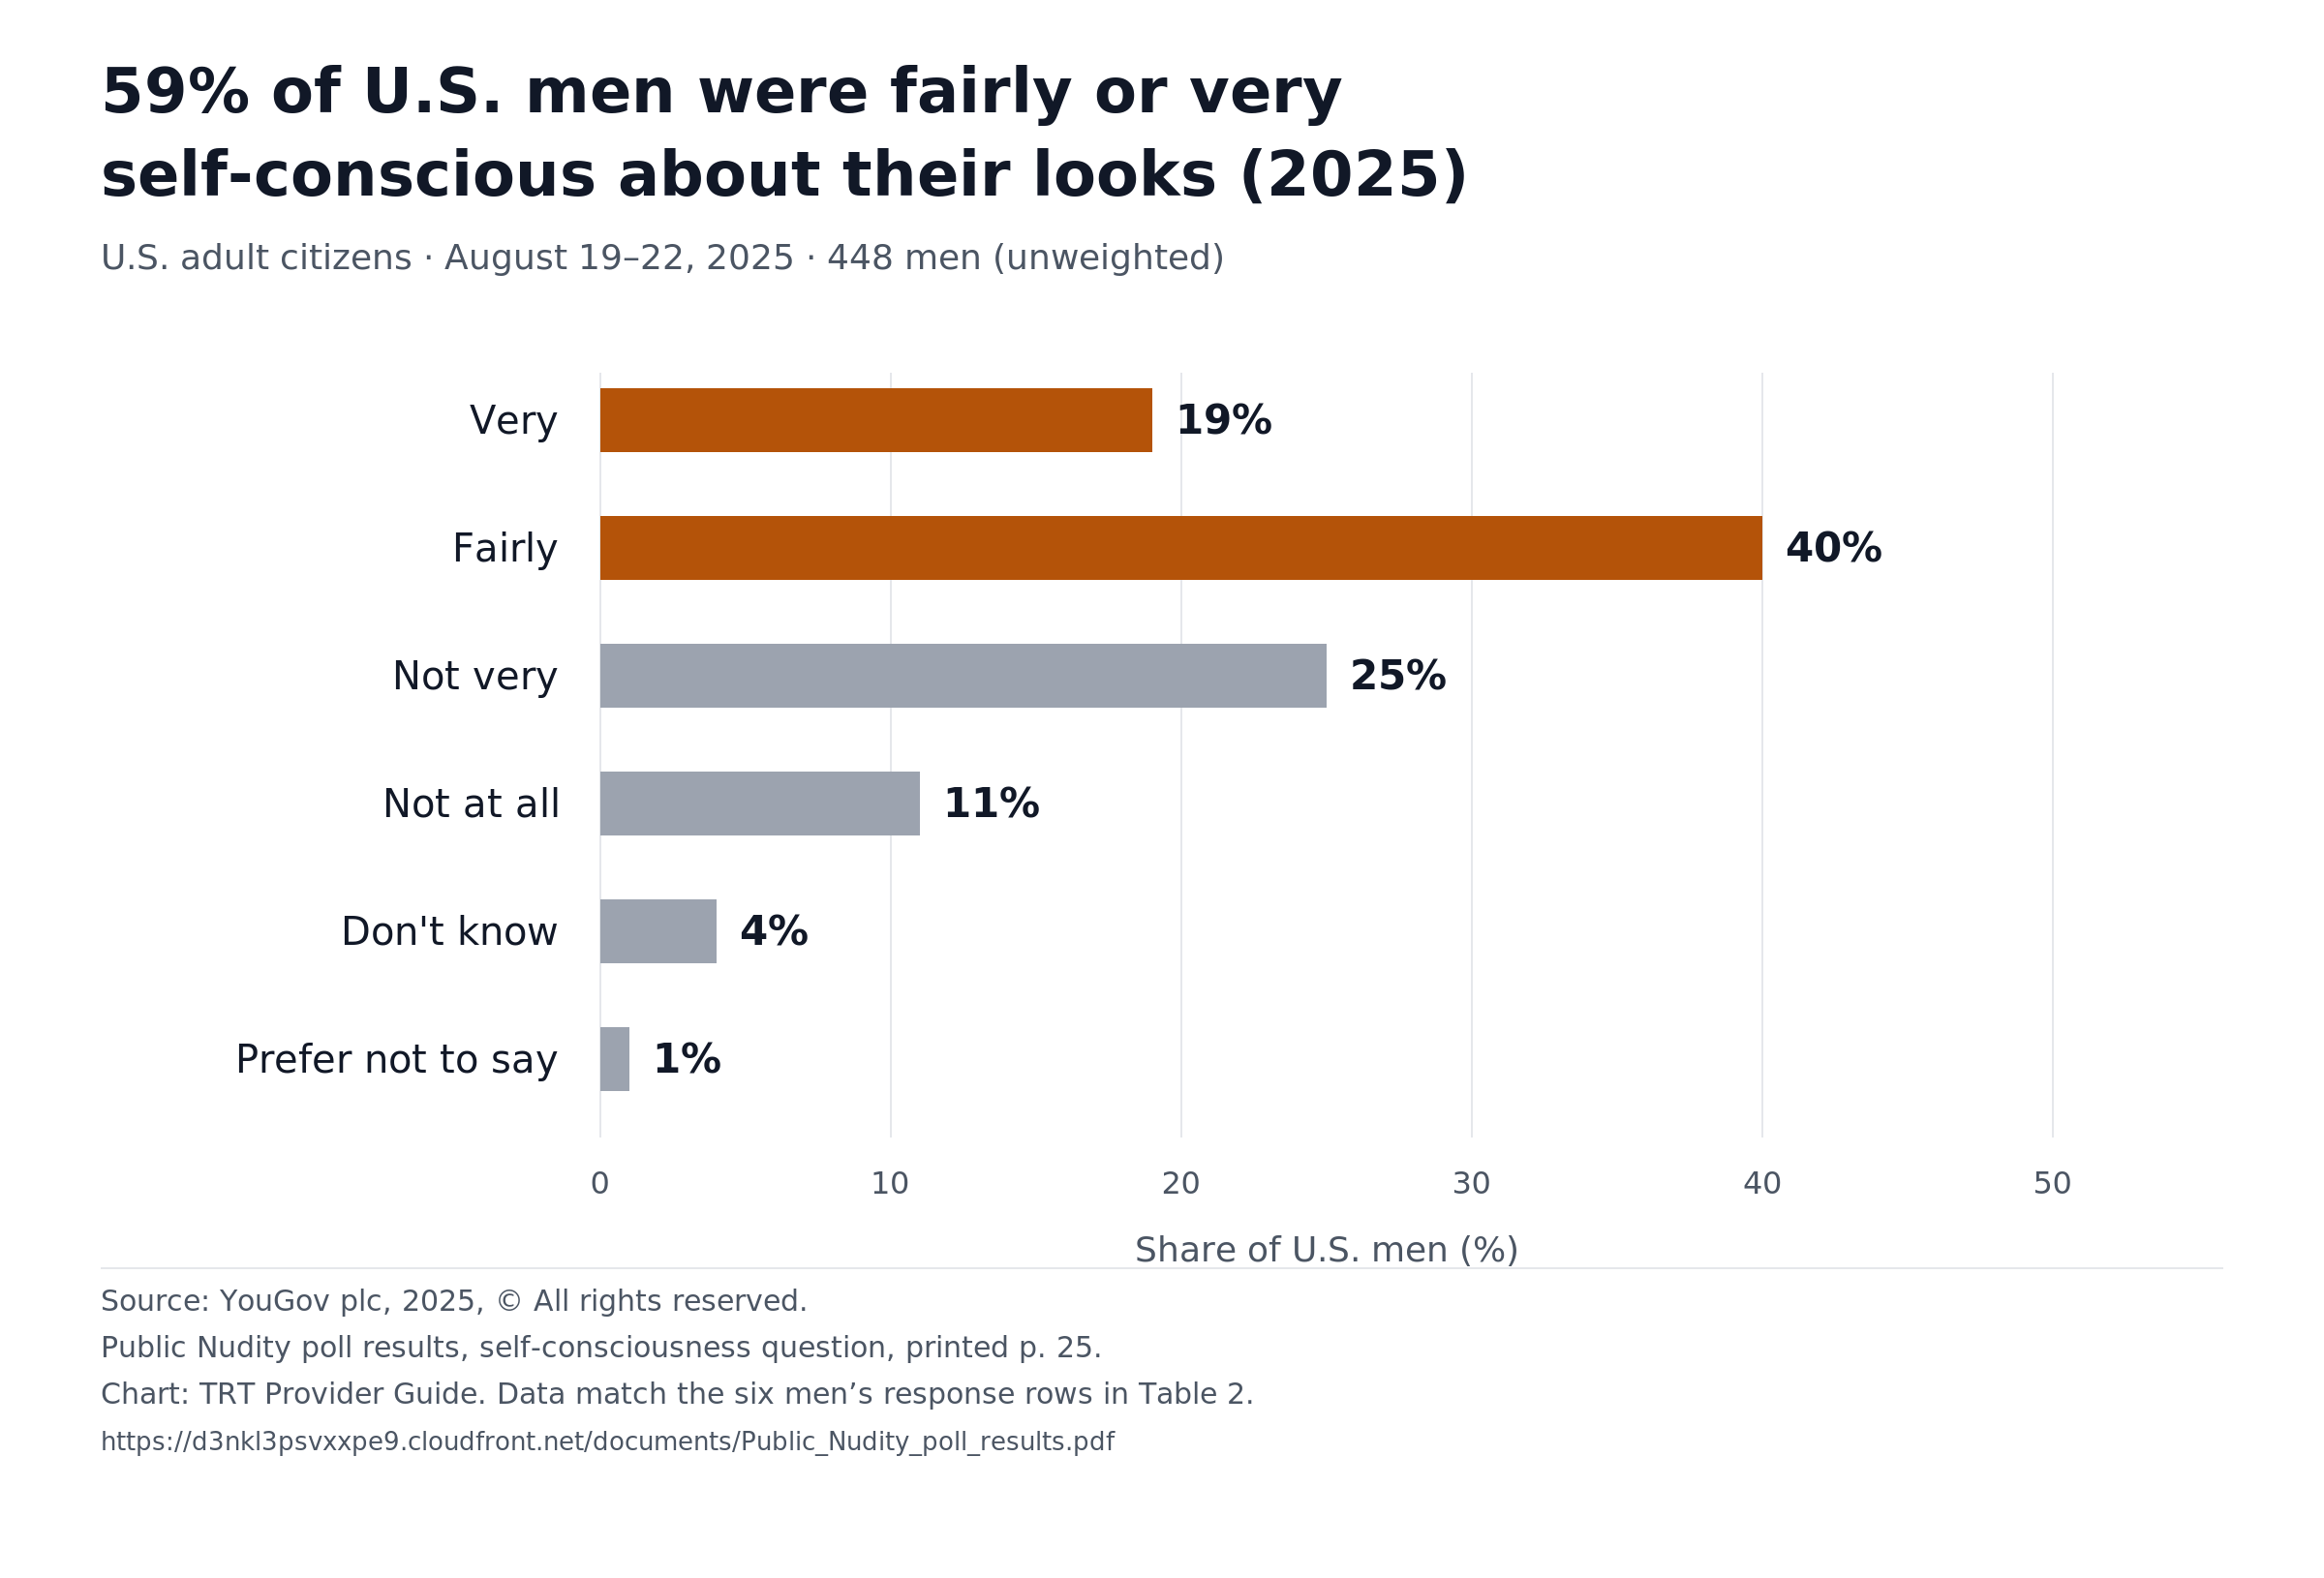
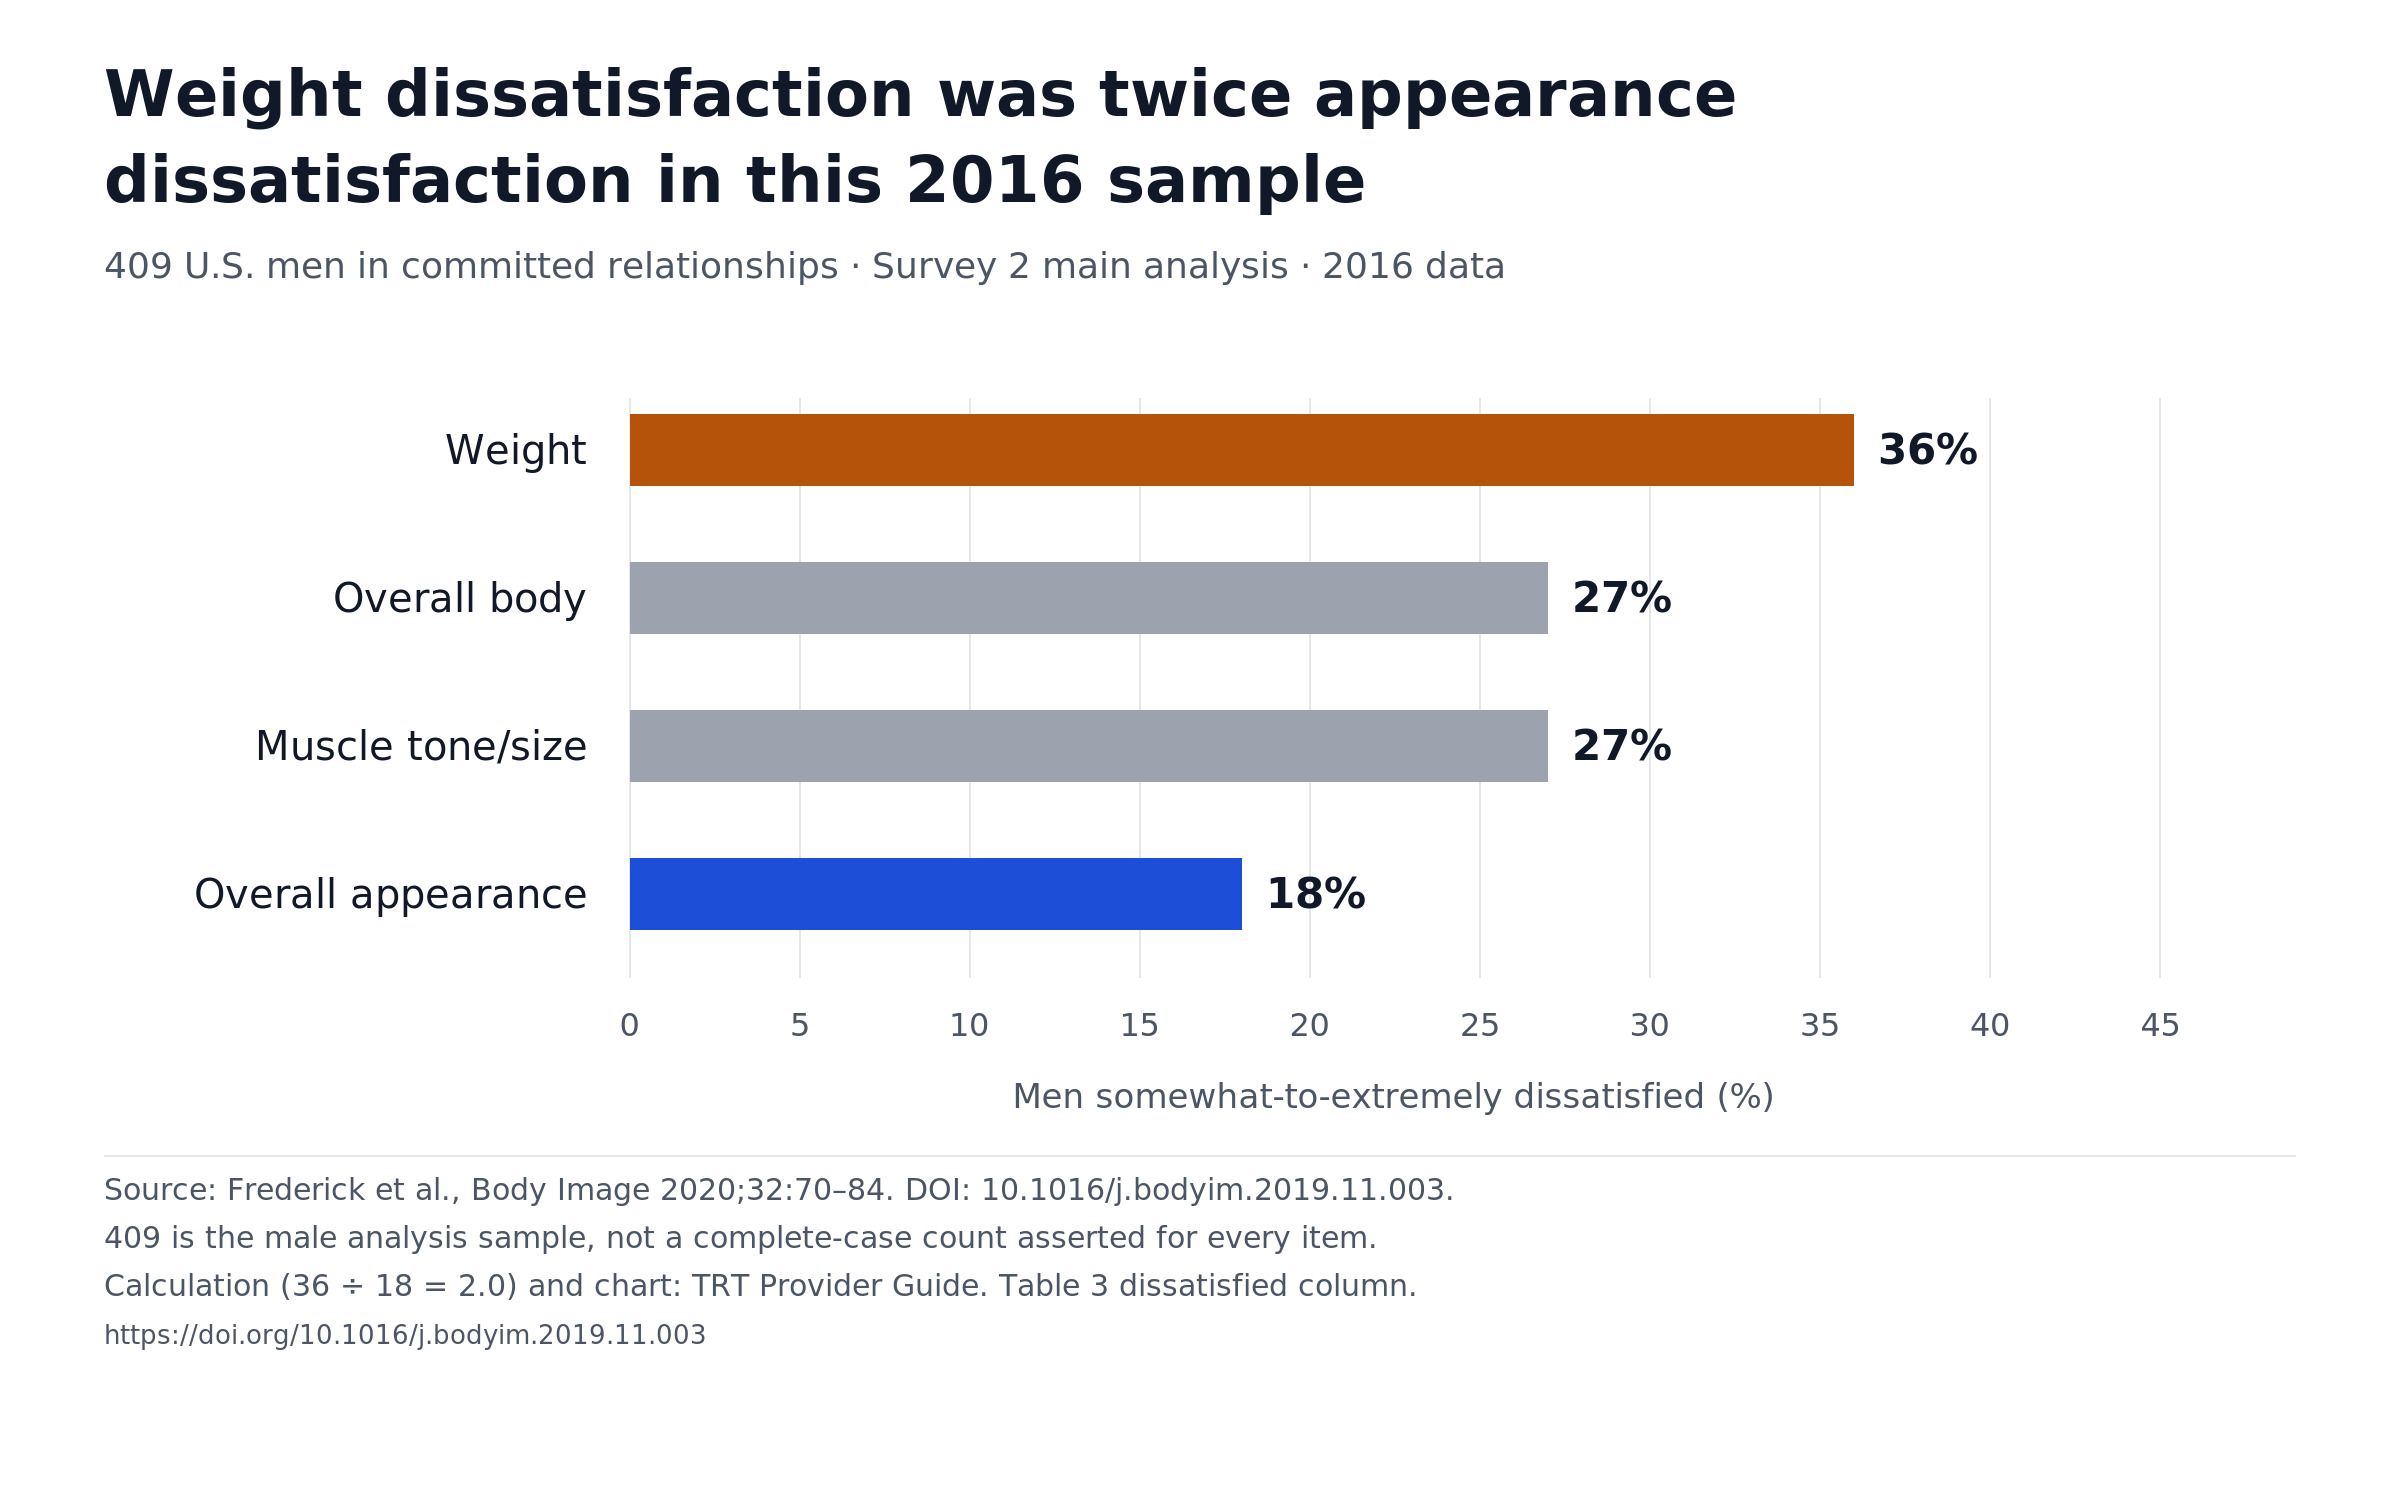
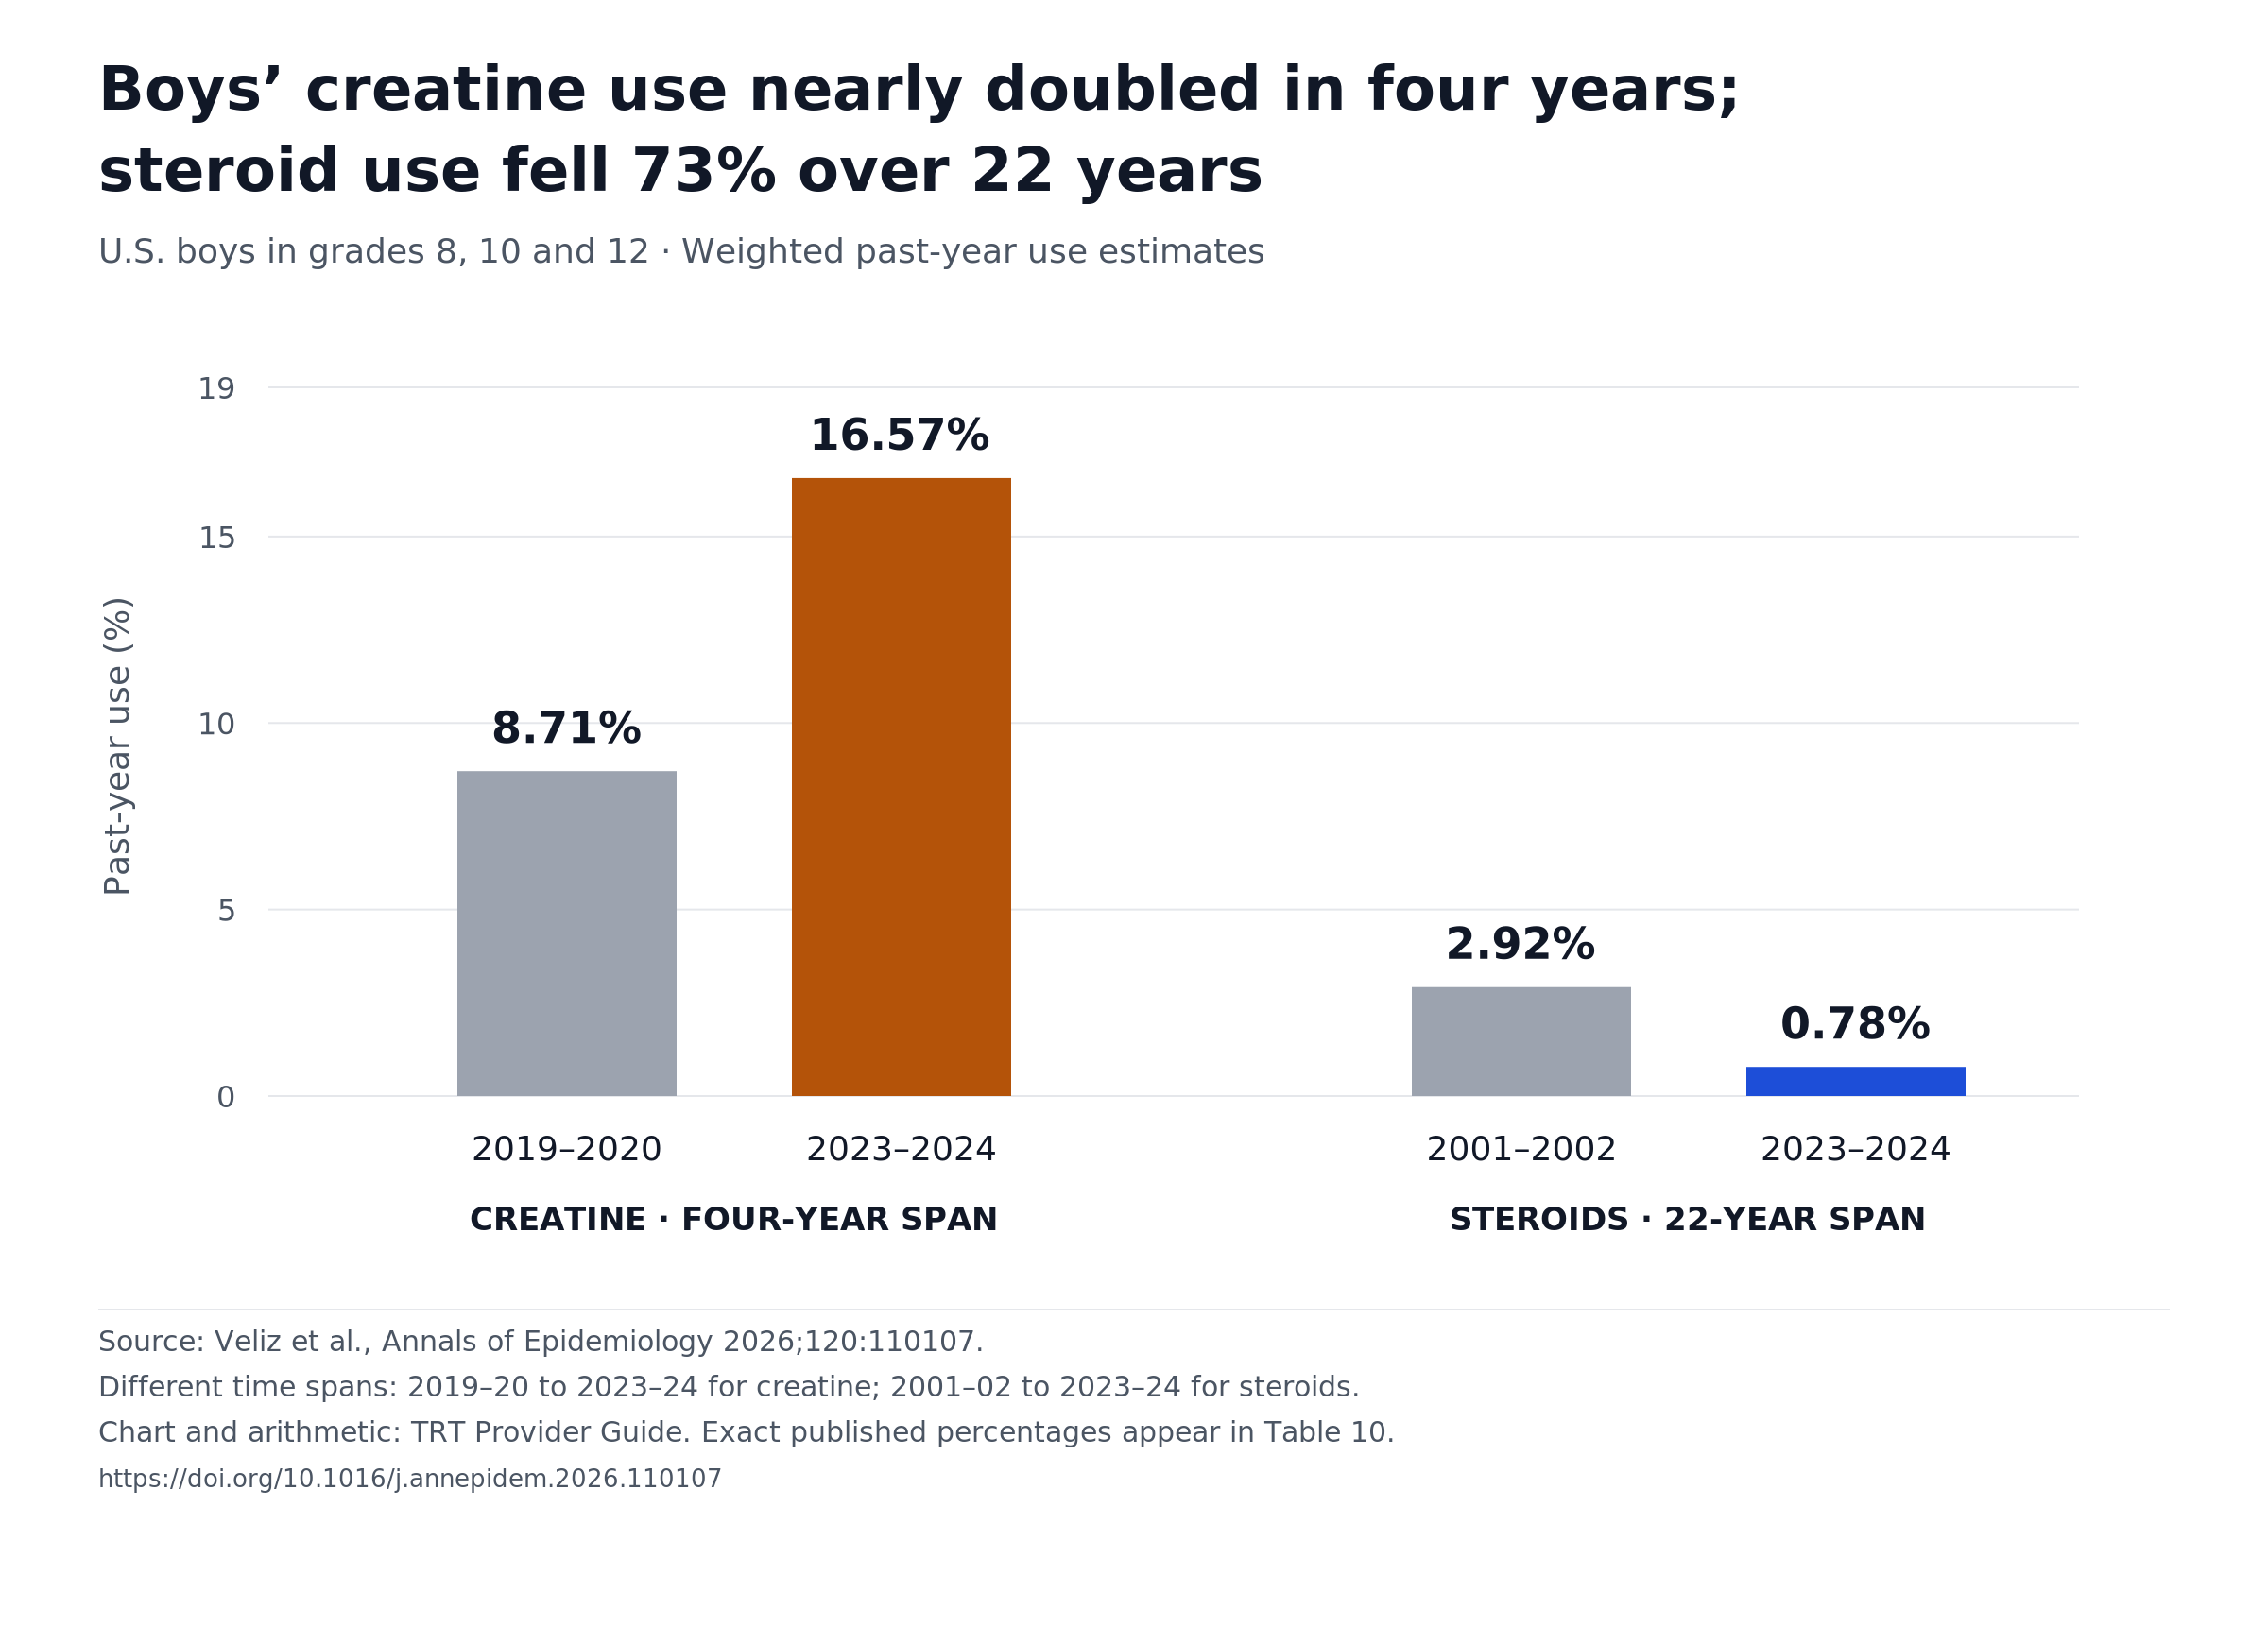
No form, no sign-up.
The Source Check gives you each finding's wording, population, date and original source. Copy those together so the number keeps its meaning.
Questions about male body image statistics
What percentage of men have body image issues?
In YouGov's August 2025 poll, 59% of U.S. adult-citizen men were fairly or very self-conscious about their appearance. That answers a feeling question, not how many have a disorder. A separate 2004 survey found 2.2% of men completing its module met BDD criteria; the two surveys are not interchangeable.
How common is male body dysmorphia?
A 2004 U.S. telephone survey found 2.2% of men met criteria for body dysmorphic disorder. A 2024 online survey found 2.8% of boys and men aged 15–35 in Canada and the U.S. met criteria for probable muscle dysmorphia, a form of it. Neither was a clinician's diagnosis. Source 1 Source 2
What is bigorexia in men?
Bigorexia is a nickname for muscle dysmorphia. It means being stuck on the belief that your body is too small or not muscular enough, even when it isn't, in a way that causes distress. In a 2024 survey recruited through social-media ads in Canada and the U.S., 2.8% of boys and men aged 15–35 met criteria for probable muscle dysmorphia. Source 1 Source 2
What are the most common body image concerns for men?
Weight tops the list in the survey that asked about several parts of the body. In the 2016 U.S. partnered-adult sample published in 2020, 36% of men were dissatisfied with their weight, 27% with their muscle tone or size, 27% with their body overall and 18% with their overall appearance. Source 1
Is it true that 1 in 10 men at the gym have muscle dysmorphia?
The 2015 BBC Newsbeat story reports a charity leader's spoken estimate and cites no study for it. A 2024 U.S.–Canada survey found 2.8% probable muscle dysmorphia among boys and men aged 15–35 recruited through social-media ads. That different sample neither confirms nor disproves a gym-goer estimate. Source 1 Source 2
What percentage of people with eating disorders are men?
Men were 7.5% of lifetime anorexia cases, 14.1% of bulimia cases and 26.7% of binge-eating disorder cases in Coffino and colleagues' analysis of 2012–2013 U.S. national-survey respondents who answered help-seeking questions. These are published weighted shares for that defined analysis, not one current percentage for all eating disorders.
Are these 2026 survey results?
No. September 2026 is when we checked the sources and did the analysis. The newest poll here was taken in August 2025, and every table shows its own years.
Do these numbers mean a man needs testosterone therapy?
No. Body image feelings and behaviors don't show whether a man has low testosterone. Doctors diagnose low testosterone with symptoms or signs plus consistently low levels confirmed by repeat early-morning blood tests. Source 1 Source 2
Sources
Sources checked September 29, 2026. Verification depth and unresolved fields are described in the method and dataset; a check date is not a new observation date.
-
YouGov. "What do Americans think of public nudity?" Survey of 1,083 U.S. adult citizens, August 19–22, 2025. Article; poll results, self-consciousness question.
-
Garner DM. "Body Image in America: Survey Results." Psychology Today, February 1, 1997. Link.
-
Hudson JI, Hiripi E, Pope HG Jr, Kessler RC. "The prevalence and correlates of eating disorders in the National Comorbidity Survey Replication." Biological Psychiatry. 2007;61(3):348–358. Link.
-
Carlat DJ, Camargo CA Jr, Herzog DB. "Eating disorders in males: a report on 135 patients." American Journal of Psychiatry. 1997;154(8):1127–1132. Link.
-
CALM. "CALM Body Talks: Getting to grips with body image." Producer page confirms 48% and 2,000 men; fieldwork dates and sampling detail not stated. BBC Newsbeat. "Body image affects half of men's mental health, new study shows" (CALM and Instagram survey). April 28, 2021. Link.
-
BBC Newsbeat. "Muscle dysmorphia: One in 10 men in gyms believed to have 'bigorexia.'" 2015. Link.
-
Eisenberg ME, Wall M, Neumark-Sztainer D. "Muscle-enhancing behaviors among adolescent girls and boys." Pediatrics. 2012;130(6):1019–1026. Full paper, Methods and Tables 1–2.
-
Nagata JM, Murray SB, Bibbins-Domingo K, et al. "Predictors of muscularity-oriented disordered eating behaviors in U.S. young adults." International Journal of Eating Disorders. 2019;52(12):1380–1388. Full paper, Table 1 and Methods; 2001–2002 outcome data.
-
YouGov. "YouGov Body Image Study 2021." Survey of 1,302 U.S. people aged 16+, April 26–27, 2021. Article; data tables.
-
Brunel University of London. "New study: Social media impacts male body image." October 17, 2024 (Bell C, Cocks AJ, Hills L, Kerner C, New Media & Society). Link.
-
Mental Health Foundation. "Millions of men in the UK affected by body image issues." 2019. Link.
-
Mental Health Foundation. "Body image in adulthood." 2019 survey report. Link.
-
Frederick DA, Garcia JR, Gesselman AN, et al. "The Happy American Body 2.0." Body Image. 2020;32:70–84. Publisher; author full-text copy, Survey 2 methods and results; 2016 data, main analysis of partnered adults.
-
Frederick DA, Essayli JH. "Male body image: The roles of sexual orientation and body mass index across five national U.S. studies." Psychology of Men & Masculinity. 2016;17(4):336–351. DOI; institutional abstract. Collection years and cell-specific denominators not verified.
-
Martin CB, Herrick KA, Sarafrazi N, Ogden CL. "Attempts to Lose Weight Among Adults in the United States, 2013–2016." NCHS Data Brief No. 313. July 2018. Brief; data table.
-
CDC. "QuickStats: Age-Adjusted Percentage of Adults Aged ≥20 Years Who Tried to Lose Weight During the Past 12 Months, by Sex." MMWR. 2018;67(41):1166. Link.
-
Koran LM, et al. "The prevalence of body dysmorphic disorder in the United States adult population." CNS Spectrums. 2008;13(4):316–322. Link.
-
Ganson KT, Mitchison D, Rodgers RF, et al. "Prevalence and correlates of muscle dysmorphia in a sample of boys and men in Canada and the United States." Journal of Eating Disorders. 2025;13:47. Link.
-
Udo T, Grilo CM. "Prevalence and correlates of DSM-5–defined eating disorders in a nationally representative sample of U.S. adults." Biological Psychiatry. 2018;84(5):345–354. Link.
-
Coffino JA, Udo T, Grilo CM. "Rates of Help-seeking in U.S. Adults With Lifetime DSM-5 Eating Disorders: Prevalence Across Diagnoses and Sex and Ethnic/Racial Differences." Mayo Clinic Proceedings. 2019;94(8). Full paper; DOI: 10.1016/j.mayocp.2019.02.030. Results: distribution of diagnoses by sex; weighted case shares in the help-seeking analysis.
-
Udo & Grilo (source 19), Discussion. Primary discussion of differences from NCS-R. Different instruments and diagnostic criteria prevent a like-for-like time-trend interpretation.
-
Veliz P, Li J, Mattar K, Pero R, Jardine J. "Recent trends in past-year steroid use, past-year creatine use, and attitudes toward steroid use among US adolescents." Annals of Epidemiology. 2026;120:110107. DOI; publisher's public first page, Methods and Results. Full article and supplement not fully inspected.
-
Pope HG Jr, Kanayama G, Athey A, et al. "The lifetime prevalence of anabolic-androgenic steroid use and dependence in Americans: current best estimates." American Journal on Addictions. 2014;23(4):371–377. Link.
-
Sagoe D, Molde H, Andreassen CS, Torsheim T, Pallesen S. "The global epidemiology of anabolic-androgenic steroid use: a meta-analysis and meta-regression analysis." Annals of Epidemiology. 2014;24(5):383–398. Primary abstract and publisher sections. Anawalt BD. "Diagnosis and Management of Anabolic Androgenic Steroid Use." Journal of Clinical Endocrinology & Metabolism. 2019;104(7):2490–2500. Review, interpretation of sample selection and clinical risks.
-
NHS. Body dysmorphic disorder. International OCD Foundation. Muscle dysmorphia expert guide. Definitions, impairment and support; not used for a national prevalence estimate.
-
National Alliance for Eating Disorders. Helpline details. ANAD. Eating disorders helpline. Numbers and published hours checked directly with each organization.
-
988 Suicide & Crisis Lifeline. Official site. Call, text or chat support is available 24/7.
-
American Urological Association. Testosterone Deficiency Guideline, published 2018, validity confirmed 2024, statements 2–3. Endocrine Society. Testosterone Therapy in Men With Hypogonadism, diagnosis and fertility guidance.
-
YouGov. Public Data License, updated March 7, 2025. Attribution, original-source link and reuse conditions; not a license from TRT Provider Guide for underlying third-party data.
-
Belov V. How I overcame bigorexia, IOL, October 5, 2015. Used only to verify the column's wording, not as evidence for prevalence.
TRT Provider Guide Research is the noncommercial research desk of trtproviderguide.com.