ADAM Questionnaire: Scoring Rule and Accuracy Across 18 Papers
The ADAM questionnaire is positive if you answer yes to question 1 (sex drive), question 7 (erections), or any 3 others.
By TRT Provider Guide · Updated September 2026
In 16 of 18 papers checked by TRT Provider Guide in September 2026, reported specificity was below 50%: most men without low testosterone still screened positive. Here's the rule and evidence. Scoring source; evidence table.
Key ADAM questionnaire statistics
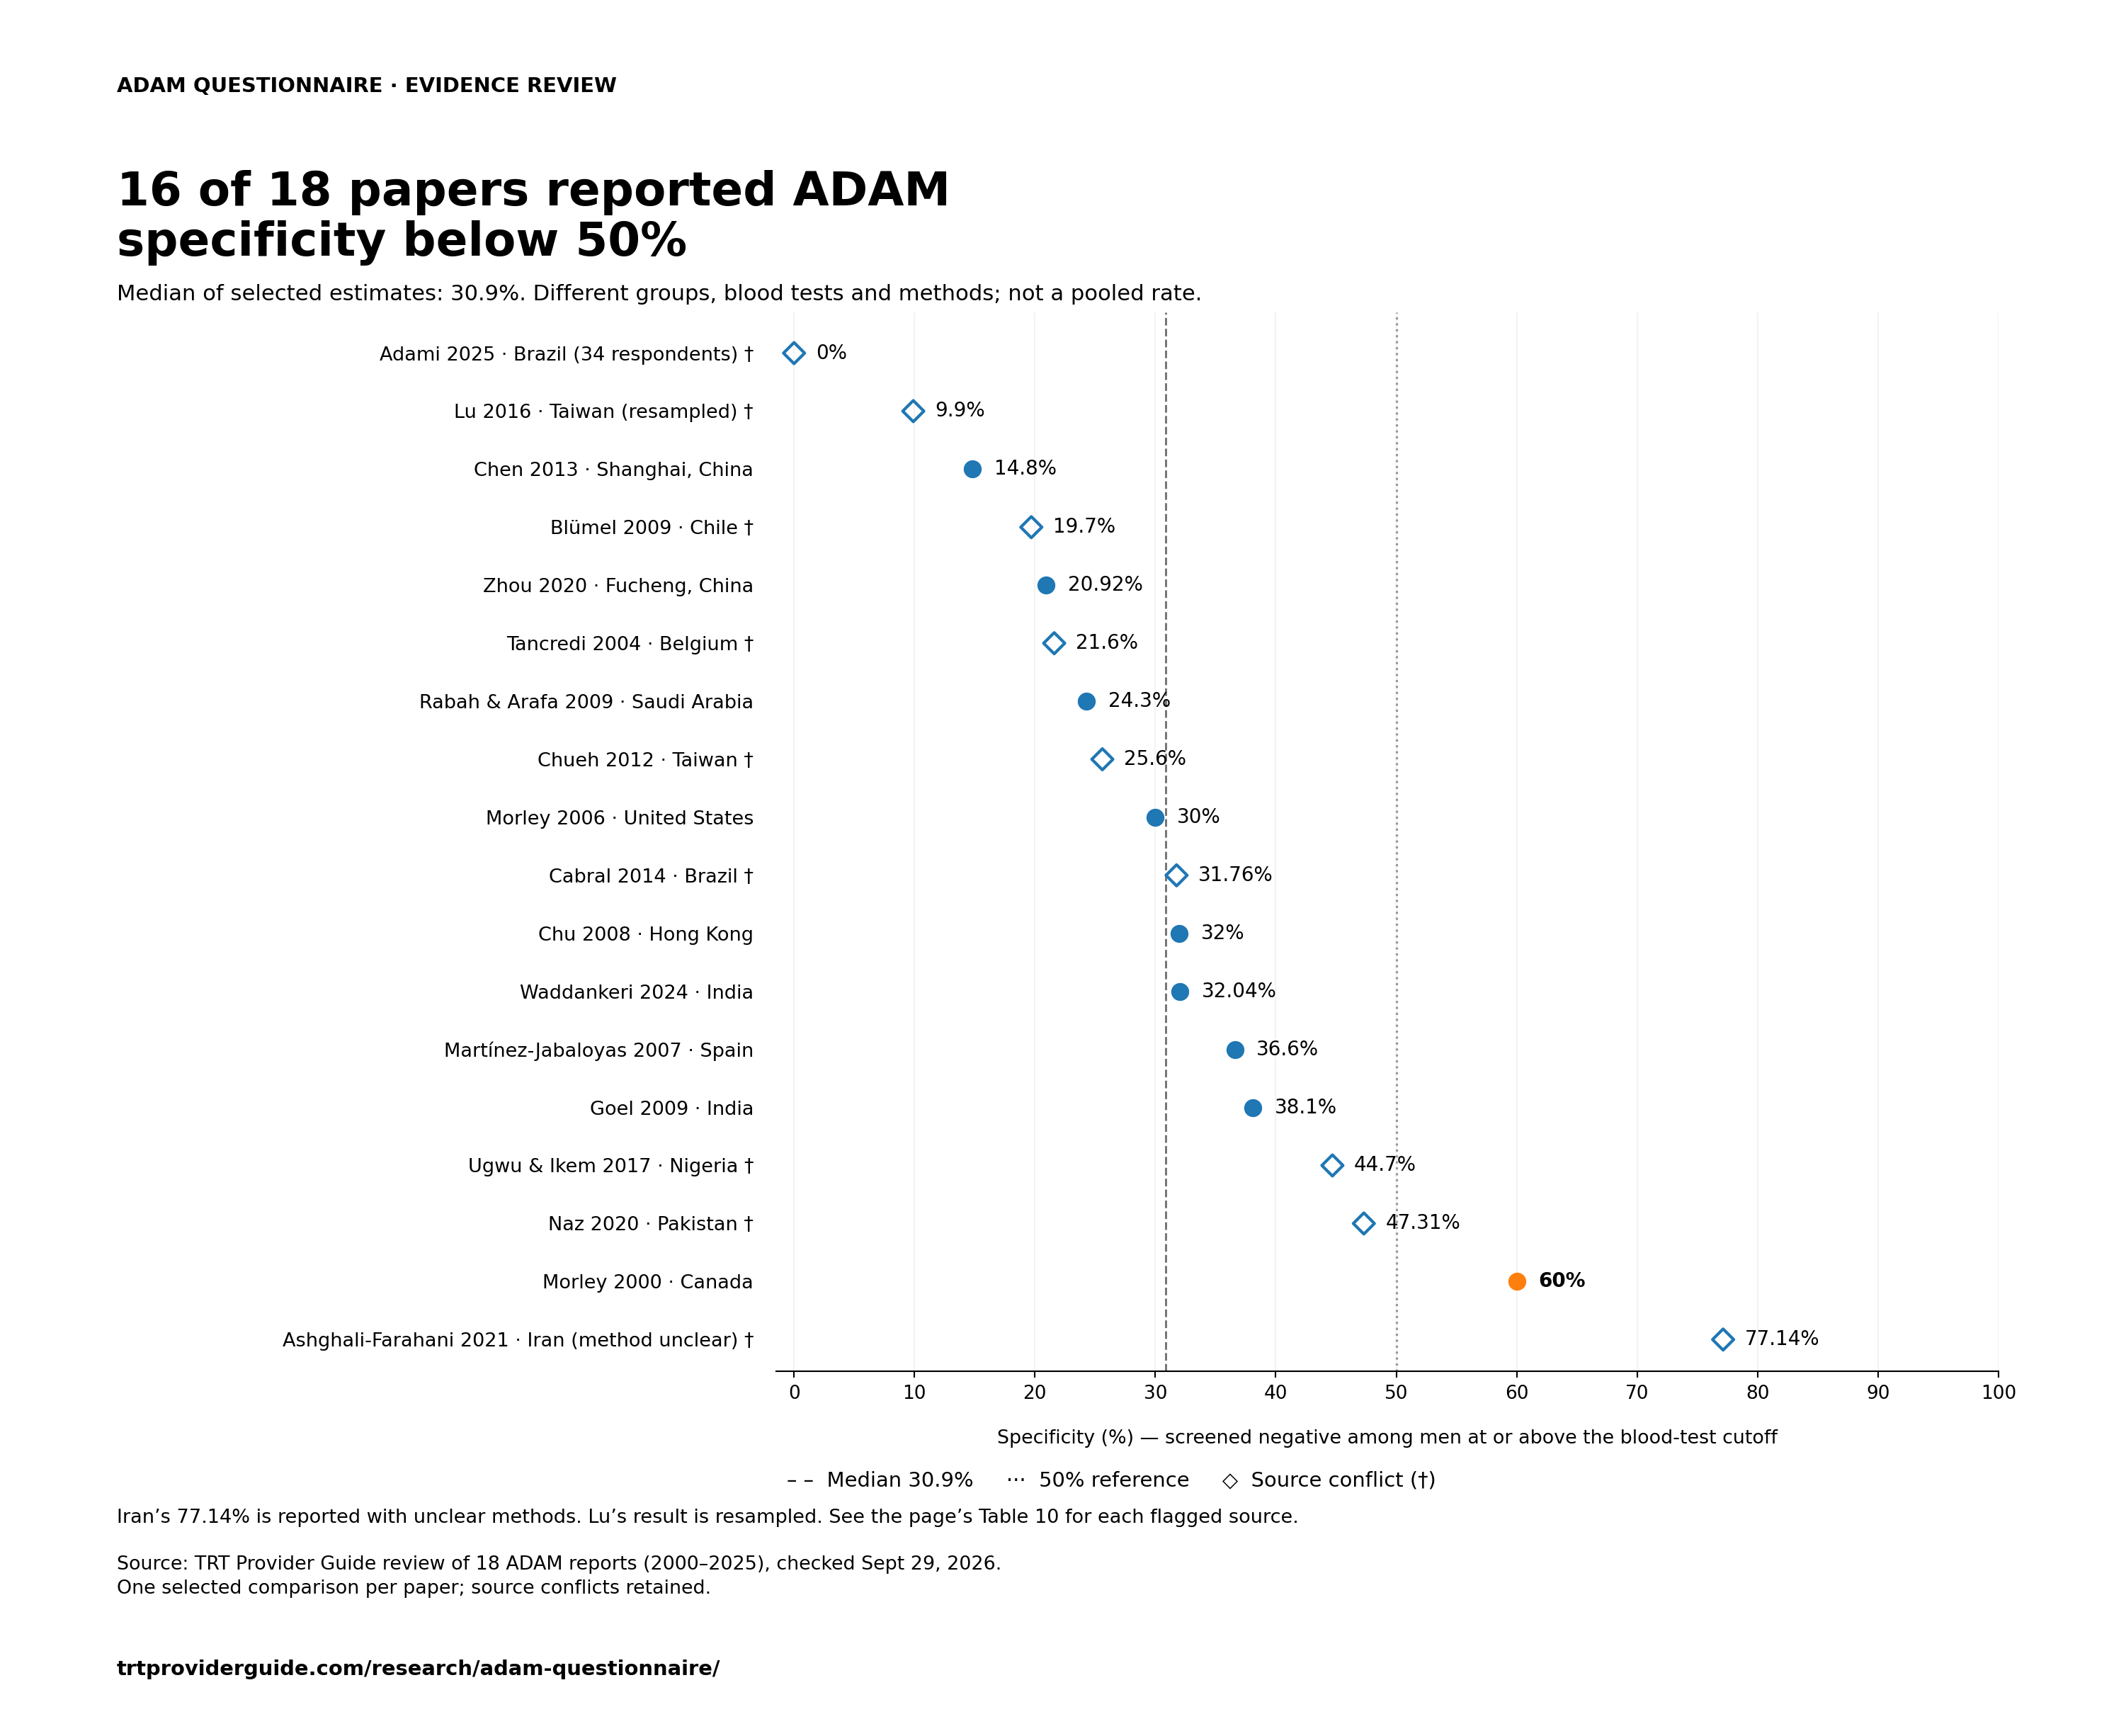
- In 16 of 18 papers reviewed by TRT Provider Guide in September 2026, the selected ADAM specificity result was below 50%. The median was 30.9%. This summarizes the selected report values, not one combined patient group. Evidence and source links.
- The widely quoted 88% sensitivity and 60% specificity comes from one 2000 study of 316 Canadian physicians aged 40 to 62 (Morley et al., Metabolism, 2000). It is not a universal ADAM accuracy rate. Original study.
- Across the same 18 papers, the median sensitivity was 86.8%, with selected estimates from 66.7% to 97% (TRT Provider Guide review, September 2026). Some reports contain conflicts or use resampling; these are marked in the table. Evidence and source links.
- A 2016 systematic review pooled 9 ADAM studies of 8,327 men and found 84% sensitivity and 29% specificity (Millar et al., CMAJ, 2016). Review, Table 2.
- In the 11 selected comparisons with a reported or reproducible predictive value, a median 38.7% of positive screens were low by that paper's blood-test rule. The range was 14.5% to 51.1% (TRT Provider Guide review, September 2026). These are not personal odds or a clinical diagnosis. Counts, estimates and sources.
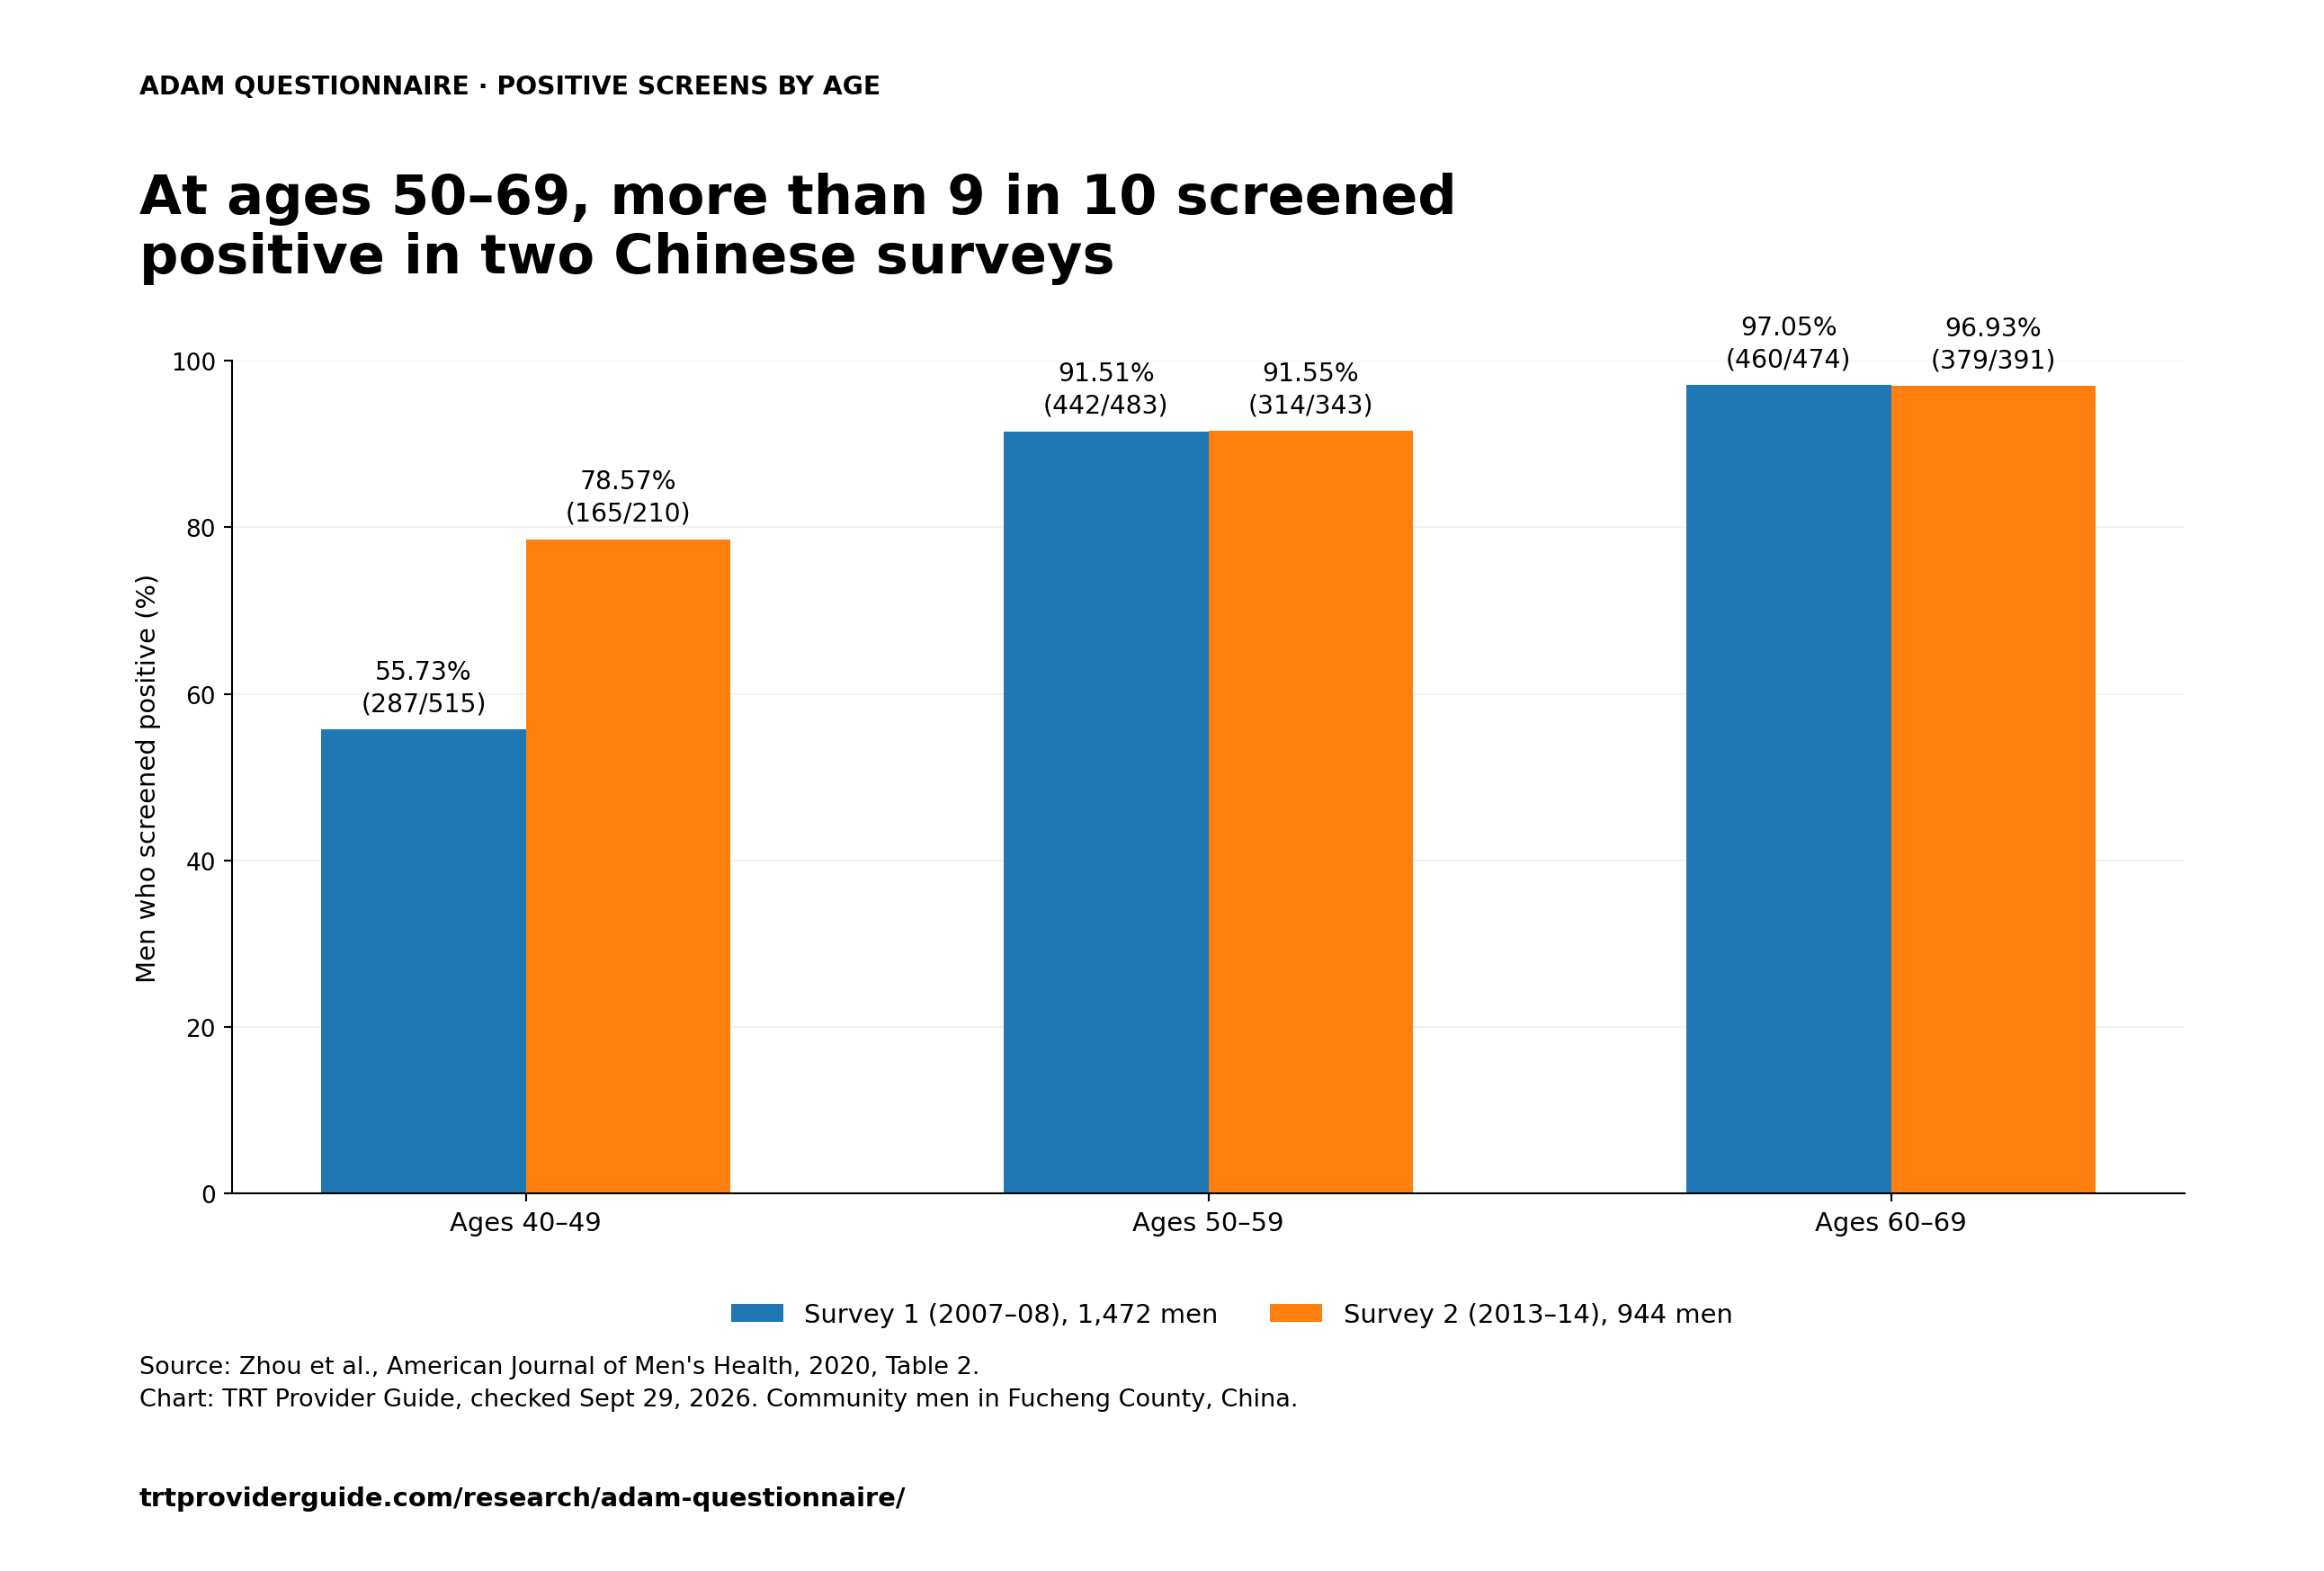
- In a random sample of men in Fucheng County, China, surveyed in 2007–2008, 97% of those aged 60 to 69 screened positive on the ADAM (460 of 474) (Zhou et al., American Journal of Men's Health, 2020). Original study, Table 2.
- Of the 1,024 possible ways to answer the 10 questions, only 37 score negative; any 3 yes answers always score positive (TRT Provider Guide scoring audit, September 2026). This counts answer patterns, not people. Rule and reproducible test cases.
- In a hypothetical group of 100 men where 25 have low testosterone, about 74 would screen positive, and about 21 of those 74 would have low testosterone (TRT Provider Guide calculation from CMAJ 2016 pooled figures). Math and source.
- Low sex drive on its own had a pooled positive likelihood ratio of 1.6, compared with 1.2 for the full 10-question ADAM in different study groups; the review's authors used above 2.0 as their useful positive-result threshold (Millar et al., CMAJ, 2016). Review, Table 2.
- The European Association of Urology's 2026 guidelines say symptom questionnaires have poor specificity and should not be used for systematic screening. EAU male-hypogonadism guidance.
- We found 18 errors or internal conflicts in 11 ADAM sources, including a journal table that prints the scoring rule wrong (TRT Provider Guide source audit, September 2026). Each discrepancy and its source.
On this page: The 10 questions · Scoring and checker · Accuracy in 18 papers · Where 88%/60% comes from · What a positive means · What a negative means · Better questions? · ADAM vs qADAM · Guidelines · Source errors · Next step · Data · FAQ
What are the 10 ADAM questions?
The ADAM (Androgen Deficiency in the Aging Male) questionnaire asks 10 yes-or-no questions about symptoms. Two are about sex: sex drive and erection strength. The other eight cover energy, strength, height, enjoyment of life, mood, sports, sleepiness after dinner, and work.
John Morley and colleagues at Saint Louis University published it in 2000. The exact wording is reprinted, with the authors' permission, in a 2003 Reviews in Urology table on the U.S. National Library of Medicine's PubMed Central site. Here's what each question is about, in our own words.
| Question | Topic (our summary) | Can it make the screen positive by itself? |
|---|---|---|
| 1 | Less sex drive (libido) | Yes |
| 2 | Low energy | No |
| 3 | Less strength or endurance | No |
| 4 | Lost height | No |
| 5 | Less enjoyment of life | No |
| 6 | Sad or grumpy | No |
| 7 | Weaker erections | Yes |
| 8 | Worse at sports lately | No |
| 9 | Falling asleep after dinner | No |
| 10 | Worse at work lately | No |
Source: Morley et al., Metabolism, 2000; question wording and scoring rule as reprinted in Reviews in Urology, 2003, Table 1. Topic labels are TRT Provider Guide summaries.
One small detail trips people up. Question 4 asks whether you've lost height, not weight. At least one journal table prints it as "weight."
How do you score the ADAM questionnaire?
The standard ADAM result is not a points total. It's positive if you answer yes to question 1 or question 7, or yes to at least 3 of the other 8 questions. With all 10 answers complete, anything else is negative.
Here's a shortcut that means exactly the same thing. Any 3 yes answers always make it positive, no matter which three. One or two yes answers make it positive only if one of them is question 1 or question 7.
| Yes answers | Result | Why |
|---|---|---|
| None | Negative | No trigger |
| Q1 only | Positive | Question 1 is a trigger on its own |
| Q7 only | Positive | Question 7 is a trigger on its own |
| Q2 only | Negative | One ordinary question isn't enough |
| Q1 and Q2 | Positive | Includes question 1 |
| Q2 and Q3 | Negative | Only 2 of the other 8 |
| Q2, Q3 and Q4 | Positive | 3 of the other 8 |
| Q4, Q9 and Q10 | Positive | 3 of the other 8 — any three count |
Source: scoring rule from Morley et al., 2000, as reprinted in Reviews in Urology, 2003 and stated in the ClinicalTrials.gov record NCT01703741. Examples by TRT Provider Guide.
Check your answers
Already filled out the ADAM? Enter your answers here and the checker applies the published rule. It tells you which part of the rule you met. It doesn't diagnose anything, and it doesn't need your name, age or email.
This checker applies the rule above to answers you have already given. It does not diagnose anything.
Your answers stay in this browser and are not sent or saved.
Yes answers: 0 of 10 (this count alone does not determine the standard ADAM result)
Incomplete
Answer the remaining questions to see a result. An unanswered question is not a 'no.'
Can two yes answers mean either result?
Yes. There are 45 ways to answer yes to exactly two questions. 17 of them are positive, because they include question 1 or 7. The other 28 are negative. So "I scored 2" doesn't tell you anything until you know which two.
Is it "3 or more" or "more than 3"?
Three or more of the other eight. Three is enough. At least one clinic's printable version says "more than 3," which quietly raises the bar. We ran every possible answer pattern through both versions: the wording change flips 56 of the 1,024 patterns from positive to negative. That's a count of ways to answer, not a count of people. But if you scored yourself with that version and got exactly 3 ordinary yeses, check again.
Is there an "ADAM score" out of 10?
The standard ADAM is a yes-or-no rule, not a total out of 10. A 2004 Belgian study of 5,028 men also tested a tally of 1 point per yes. Its abstract gives an area under the ROC curve (AUC) of 0.529; its Results section gives 0.519. AUC measures how well a score separates the two groups: 0.5 is chance-level separation and 1.0 is perfect. Neither value is a percentage of answers that were correct. A different, graded version called the qADAM uses a 10-to-50 scale (see ADAM vs qADAM).
Source: Tancredi et al., European Journal of Endocrinology, 2004.
How accurate is the ADAM questionnaire?
In 16 of 18 papers, the selected specificity estimate was below 50%. The median sensitivity was 86.8%, and the median specificity was 30.9% in TRT Provider Guide's September 2026 review. These are summaries of the numbers in Table 3, not a pooled estimate or your odds.
A 2021 Iranian report gives 77.14% specificity, but its testosterone-cutoff units and the direction of its ROC analysis are unclear. Lu 2016 reports a resampled benchmark, not one simple patient table. Both are labeled below. Iranian report; Lu 2016.
Two words do all the work here, so let's pin them down.
- Sensitivity is the share of men below the study's blood-test cutoff who screen positive. High is good: few are missed.
- Specificity is the share of men at or above the study's blood-test cutoff who screen negative. High is good: few false alarms.
Most selected reports show higher sensitivity than specificity. In plain terms, they caught more of the men below the blood-test cutoff than they correctly screened negative above it. A negative screen is not a clean bill of health, and a positive is not a diagnosis.
| # | Study | Where | Men in the comparison | What counted as "low" | Caught low T (sensitivity) | Screened negative without low T (specificity) |
|---|---|---|---|---|---|---|
| S01 | Morley 2000 | Canada | 316 physicians, ages 40–62 | Low bioavailable testosterone; numeric cutoff unavailable in checked abstract | 88% | 60% |
| S02 | Tancredi 2004† | Belgium | 5,028 men, ages 50–70 | Free testosterone below 70 ng/L | 81% | 21.6% |
| S03 | Morley 2006 | United States | 148 men, ages 23–80 | Bioavailable testosterone below 70 ng/dL | 97% | 30% |
| S04 | Martínez-Jabaloyas 2007 | Spain | 230 urology outpatients over 50 | Authors' biochemical definition; exact cutoff unavailable in checked abstract | 84% | 36.6% |
| S05 | Chu 2008 | Hong Kong | 796 men, ages 18–89 | Bioavailable testosterone below the 5th percentile in Chinese men ages 18–29 | 88% | 32% |
| S06 | Goel 2009 | India | 157 hospital workers, ages 40–60 | Low free testosterone; numeric cutoff unavailable in checked abstract | 78.8%* | 38.1%* |
| S07 | Blümel 2009† | Chile | 96 men, 40 and older | Calculated available testosterone below 198.4 ng/dL | 83.3% | 19.7% |
| S08 | Rabah & Arafa 2009 | Saudi Arabia | 407 men, ages 18–80 | Bioavailable testosterone below the 10th percentile in Saudi men ages 18–30 | 86.5% | 24.3% |
| S09 | Chueh 2012† | Taiwan | 339 men, ages 47–65 | Total below 300 ng/dL and calculated free below 5 ng/dL | 66.7% | 25.6% |
| S10 | Chen 2013 | China (Shanghai) | 985 men | Total below 300 ng/dL and calculated free below 5 ng/dL | 78.7% | 14.8% |
| S11 | Cabral 2014† | Brazil | 459 in Table 6, 40 and older; abstract says 460 | Calculated free testosterone below 65 pg/mL (Table 6) | 73.45%* | 31.76%* |
| S12 | Lu 2016†‡ | Taiwan | 772 men, ages 41–80; resampled results‡ | Free testosterone ≤6.5; unit missing in the source definition | 87.8% | 9.9% |
| S13 | Ugwu & Ikem 2017† | Nigeria | 153 in Table 4; study enrolled 200, ages 30–69 | Total testosterone below 8 nmol/L | 88.1% | 44.7% |
| S14 | Naz 2020† | Pakistan | 248 in Table 3; study enrolled 255, ages 30–69 | Low total testosterone; Methods have an unresolved cutoff-unit error | 90.12% | 47.31% |
| S15 | Zhou 2020 | China (Fucheng County) | 428 tested, ages 40–69 | Total testosterone below 9.13 nmol/L | 88.33% | 20.92% |
| S16 | Ashghali-Farahani 2021† | Iran | 200 hospital patients over 50 | Reported testosterone cutoff 2.20; units and ROC direction unclear† | 93.85% | 77.14% |
| S17 | Waddankeri 2024 | India | 250 men with type 2 diabetes | Total testosterone; numeric cutoff unavailable in checked abstract | 84.05% | 32.04% |
| S18 | Adami 2025† | Brazil | 34 questionnaire respondents; 38 enrolled | One fasting total-testosterone value below 346 ng/dL | 87% | 0% |
| Median of 18 selected estimates | 86.8% | 30.9% | ||||
| Pooled review (CMAJ 2016) | 9 studies | 8,327 men | Each study's own definition | 84% | 29% |
Source: TRT Provider Guide review of the linked papers, checked September 29, 2026. *Calculated from published diagnostic-table counts. †A source conflict is documented in Table 10. ‡Lu's figures are mean resampled results, not one 772-person diagnostic table. Missing details remain unavailable, not filled from a later paper.
Selection: each paper contributes one comparison to this descriptive summary. We use the featured whole-ADAM comparison in each report, with Cabral's Table 6 cells used when its abstract conflicts. The Iranian 2021, Indian 2024 and Brazilian 2025 reports are included with their stated limits. Zhou contributes its first survey's total-testosterone result. Verified alternatives are in the CSV; they do not become extra papers. This is not a complete census of all ADAM research.
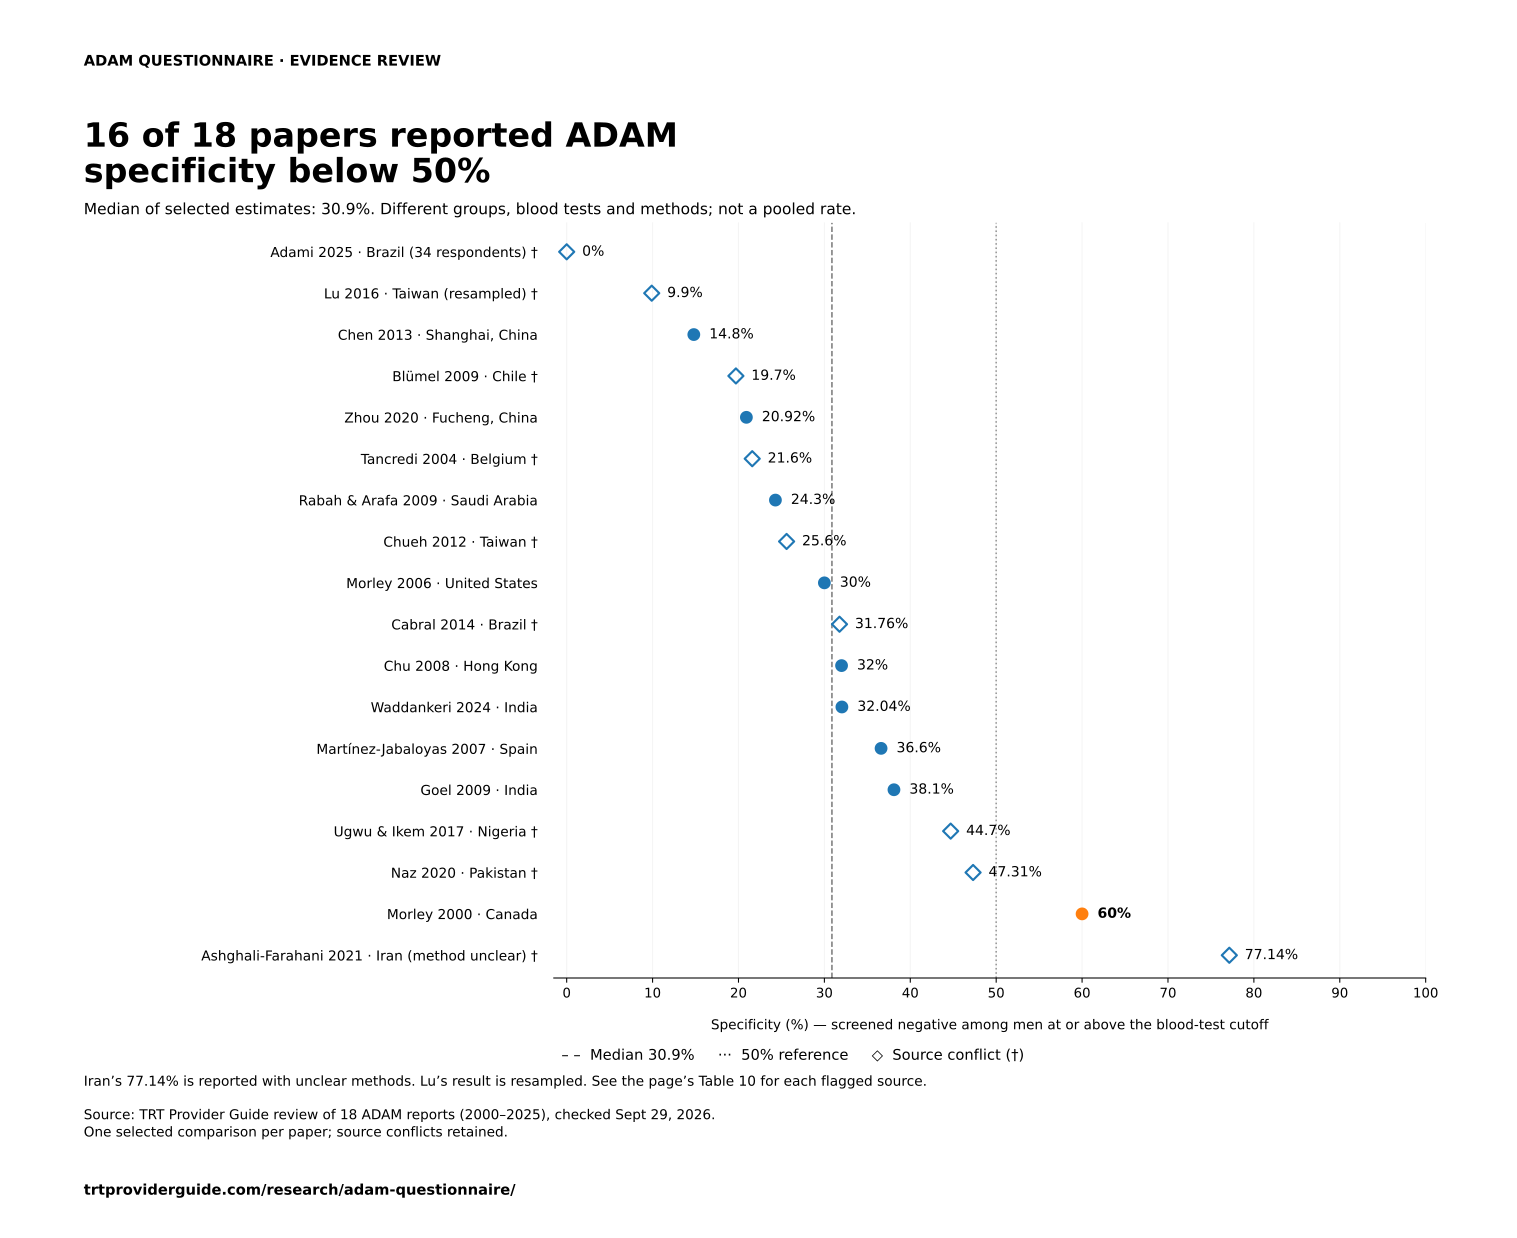
Source: TRT Provider Guide review of 18 ADAM reports (2000–2025), checked Sept 29, 2026. One selected comparison per paper; source conflicts retained. trtproviderguide.com/research/adam-questionnaire/
Why don't we average these into one number?
Because the studies measured "low testosterone" in different ways. Some used total testosterone, some free, some bioavailable (free testosterone plus the part loosely bound to albumin), each with its own cutoff. They also tested different groups, and one used resampling. A single combined rate would need a method that accounts for those differences.
The median does not solve that problem. It is only the middle of our selected report values: 30.88%, rounded to 30.9%. It is not a personal risk estimate or a claim that the papers are equally reliable. The separate 2016 review pooled 9 ADAM studies using its own methods and reported 29% specificity. Its study set is not identical to ours. Review.
Where does the "88% sensitivity, 60% specificity" figure come from?
It comes from the ADAM's first test, published in 2000: 316 Canadian physicians aged 40 to 62, checked against bioavailable testosterone. It's a real result for that group. The 60% specificity is not the highest published result: the 2021 Iranian report gives 77.14%, with methodological conflicts documented below.
A few things about that first study are worth knowing:
- It tested doctors, not the general public. Working physicians in their 40s, 50s and early 60s aren't a typical clinic crowd.
- About 1 in 4 of them (25%) had low bioavailable testosterone.
- The repeat test was tiny. To see whether answers stayed stable, the authors re-gave the questionnaire to 10 men, 2 to 4 weeks apart.
- Even here, most positives weren't low. Using the paper's own numbers, about 52% of the doctors would have screened positive, and about 42% of those positives had low bioavailable testosterone. That's our calculation from the reported rates, so treat it as approximate.
Source: Morley et al., Metabolism, 2000; calculation by TRT Provider Guide.
Two easy ways to misread it
"88% sensitive" does not mean an 88% chance you have low testosterone if you screen positive. It means the ADAM caught 88 of every 100 men who were low in that study.
"60% specific" does not mean "40% of positive results are wrong." It means 40 of every 100 men with normal testosterone got flagged anyway. The two statements use different denominators. In 16 of our 18 selected report results, specificity was below 50%, so the corresponding reported false-positive rate was above 50%. That does not turn either rate into a personal probability.
What does a positive ADAM result mean?
A positive means your answers matched the rule, not that your testosterone is low. In the 11 selected comparisons where predictive value is reported or reproducible, a median 38.7% of positive screens were below that paper's blood-test cutoff. The range is 14.5% to 51.1%. This is a summary of those comparisons, not your odds.
It's a bit like a smoke alarm that also goes off when you make toast. A beep alone doesn't tell you whether there's a fire. Here, the clinical history and blood tests do work that a questionnaire cannot. Diagnostic guidance.
| # | Study and comparison | Share with low T | Share screened positive | Share of positives low on the blood test |
|---|---|---|---|---|
| S01 | Morley 2000 | 25.0% | 52.0% (estimate) | 42.3% (estimate) |
| S02 | Tancredi 2004† | 38.6% | 79.4% | 39.3% |
| S06 | Goel 2009 | 33.1% | 67.5% | 38.7% |
| S07 | Blümel 2009† | 28.1% | 81.3% | Not reconstructed |
| S08 | Rabah & Arafa 2009 | 18.2% | 77.6% | 20.3% |
| S09 | Chueh 2012† | 15.9% | 73.2% | 14.5% |
| S10 | Chen 2013 | Not available | Not available | 22.5% |
| S11 | Cabral 2014 (Table 6 cells total 459)† | 49.2% | 70.8% | 51.1% |
| S13 | Ugwu & Ikem 2017 (Table 4 cells total 153)† | 38.6% | 68.0% | 50.0% |
| S14 | Naz 2020 (Table 3 cells total 248)† | 32.7% | 64.9% | 45.3% |
| S15 | Zhou 2020 (428-person diagnostic subset) | 14.0% | 80.4% (reconstructed) | 15.4% (reconstructed) |
| S17 | Waddankeri 2024 | 27.6% | 72.4% (reconstructed) | 32.0% (reconstructed) |
| Median of available selected comparisons | — | 72.4% (11) | 38.7% (11) |
Source: the original papers linked in each row, checked September 29, 2026. The positive-share and predictive-value medians each have 11 values, but not exactly the same rows. †A conflict elsewhere in the paper remains documented in Table 10. Each row uses one stated denominator rather than mixing questionnaire-only respondents with tested men. A table-cell total is not proof that the paper documented a smaller patient subset.
Counts and formulas: positive share = (true positives + false positives) ÷ all men in that comparison; predictive value = true positives ÷ all positives. Morley 2000 uses rounded source rates, so its derived values are estimates. Zhou S1 and Waddankeri 2024 use integer counts reconstructed from their sample totals and reported diagnostic rates. Waddankeri permits a rounding or truncation difference of less than 0.01 percentage point; these are not published raw cells. The CSV records the basis for every value. Blümel's incompatible percentages are not used to invent a predictive value.
Why does the positive share run so high? Two single questions — sex drive and erections — can each trigger a positive alone. And the other eight ask about things plenty of men notice as they age. In the Chinese surveys below, the authors noted that men tended to answer yes to exactly those two questions. The older the group, the higher the positive rate climbed.
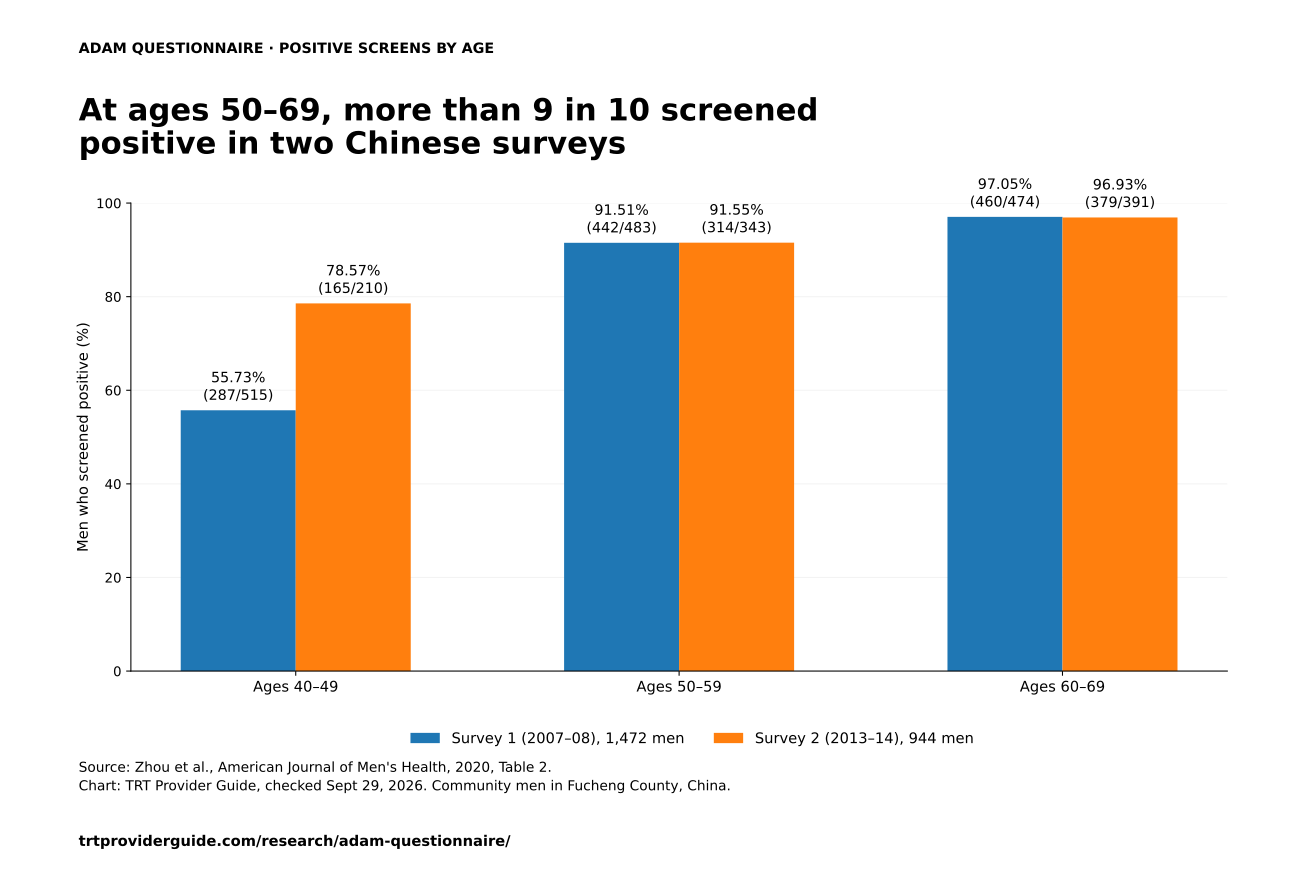
Source: Zhou et al., American Journal of Men's Health, 2020, Table 2. Chart: TRT Provider Guide, checked Sept 29, 2026. trtproviderguide.com/research/adam-questionnaire/
| Age group | Survey 1 (Aug 2007 – Nov 2008) | Survey 2 (Jul 2013 – Jan 2014) |
|---|---|---|
| 40–49 | 55.73% (287 of 515) | 78.57% (165 of 210) |
| 50–59 | 91.51% (442 of 483) | 91.55% (314 of 343) |
| 60–69 | 97.05% (460 of 474) | 96.93% (379 of 391) |
| Ages 40–69 combined | 80.77% (1,189 of 1,472) | 90.89% (858 of 944) |
Source: Zhou et al., American Journal of Men's Health, 2020, Table 2. Random samples of community men in Fucheng County, Hebei Province, China.
It isn't just one place. In a Korean community screening of 534 men over 40, 92.5% screened positive on the Korean-language ADAM (494 of 534, screened during 2004–2012) (Korean Journal of Urology, 2013).
Out of 100 men: a worked example
Say 100 men take the ADAM, and 1 in 4 of them truly has low testosterone. Using the pooled review's figures (84% sensitivity, 29% specificity):
- Of the 25 men with low testosterone, about 21 screen positive and 4 are missed.
- Of the 75 men with normal testosterone, about 53 screen positive anyway.
- That's 74 positives in all, and only about 21 of them (28%) have low testosterone.
This is a hypothetical group, not a real one. The mix of low and normal men changes the answer, as the table shows.
| If this share of men has low T | Screen positive (per 100 men) | Positives who actually have low T | Share of positives confirmed |
|---|---|---|---|
| 1 in 10 | 72 | 8 | 11.6% |
| 1 in 4 | 74 | 21 | 28.3% |
| 2 in 5 | 76 | 34 | 44.1% |
Source: TRT Provider Guide calculation from Millar et al., CMAJ, 2016 (pooled sensitivity 84%, specificity 29%). Counts rounded to whole men; shares use unrounded values.
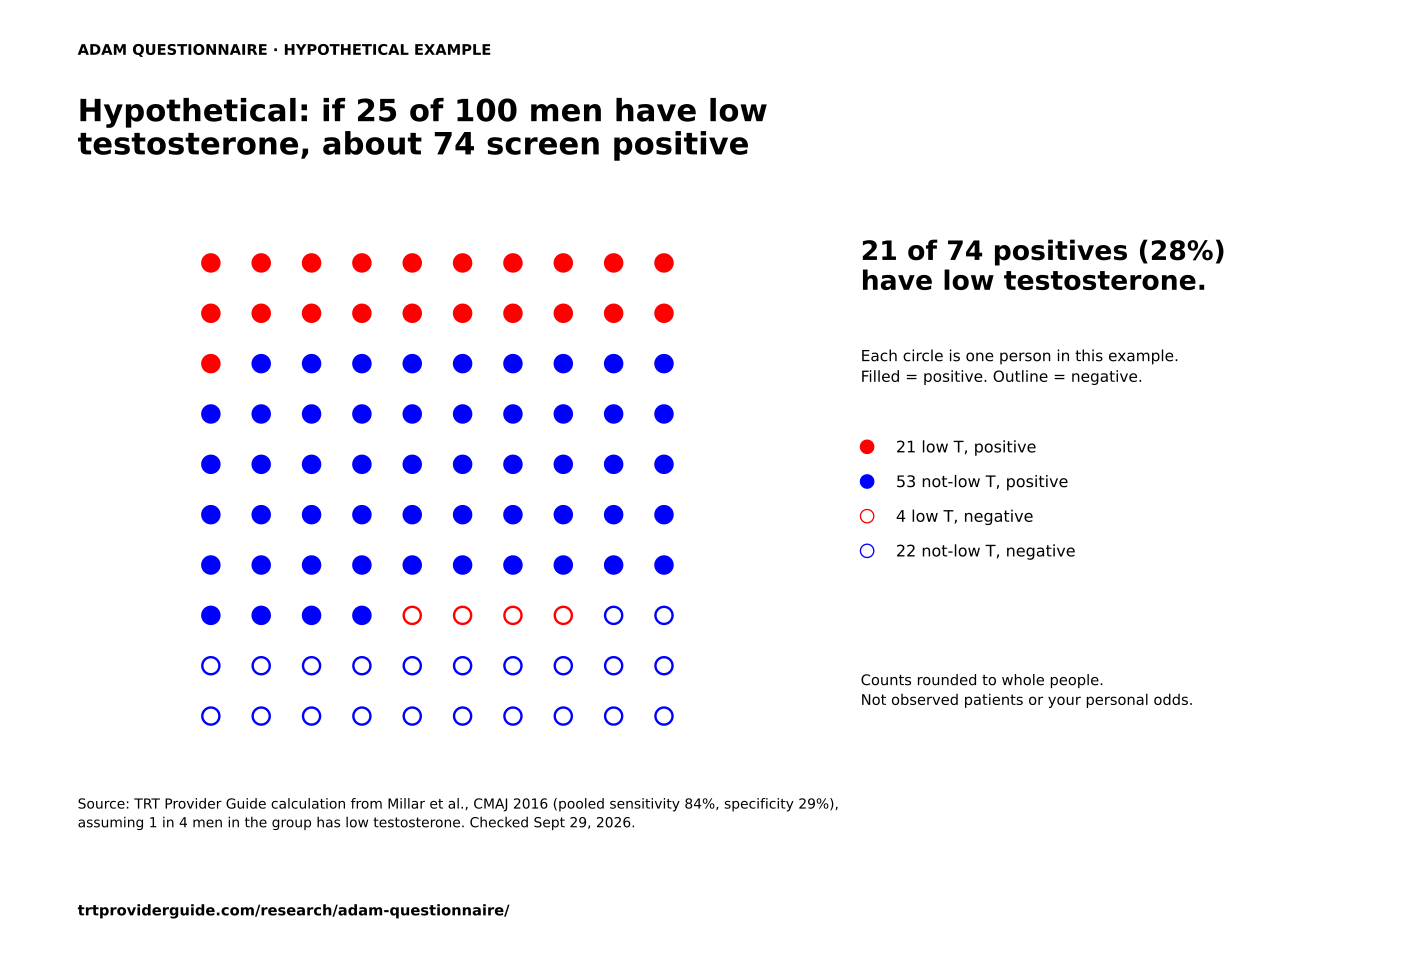
Source: TRT Provider Guide calculation from Millar et al., CMAJ 2016 (pooled sensitivity 84%, specificity 29%), assuming 1 in 4 men in the group has low testosterone. Checked Sept 29, 2026. trtproviderguide.com/research/adam-questionnaire/
What does a negative ADAM result mean?
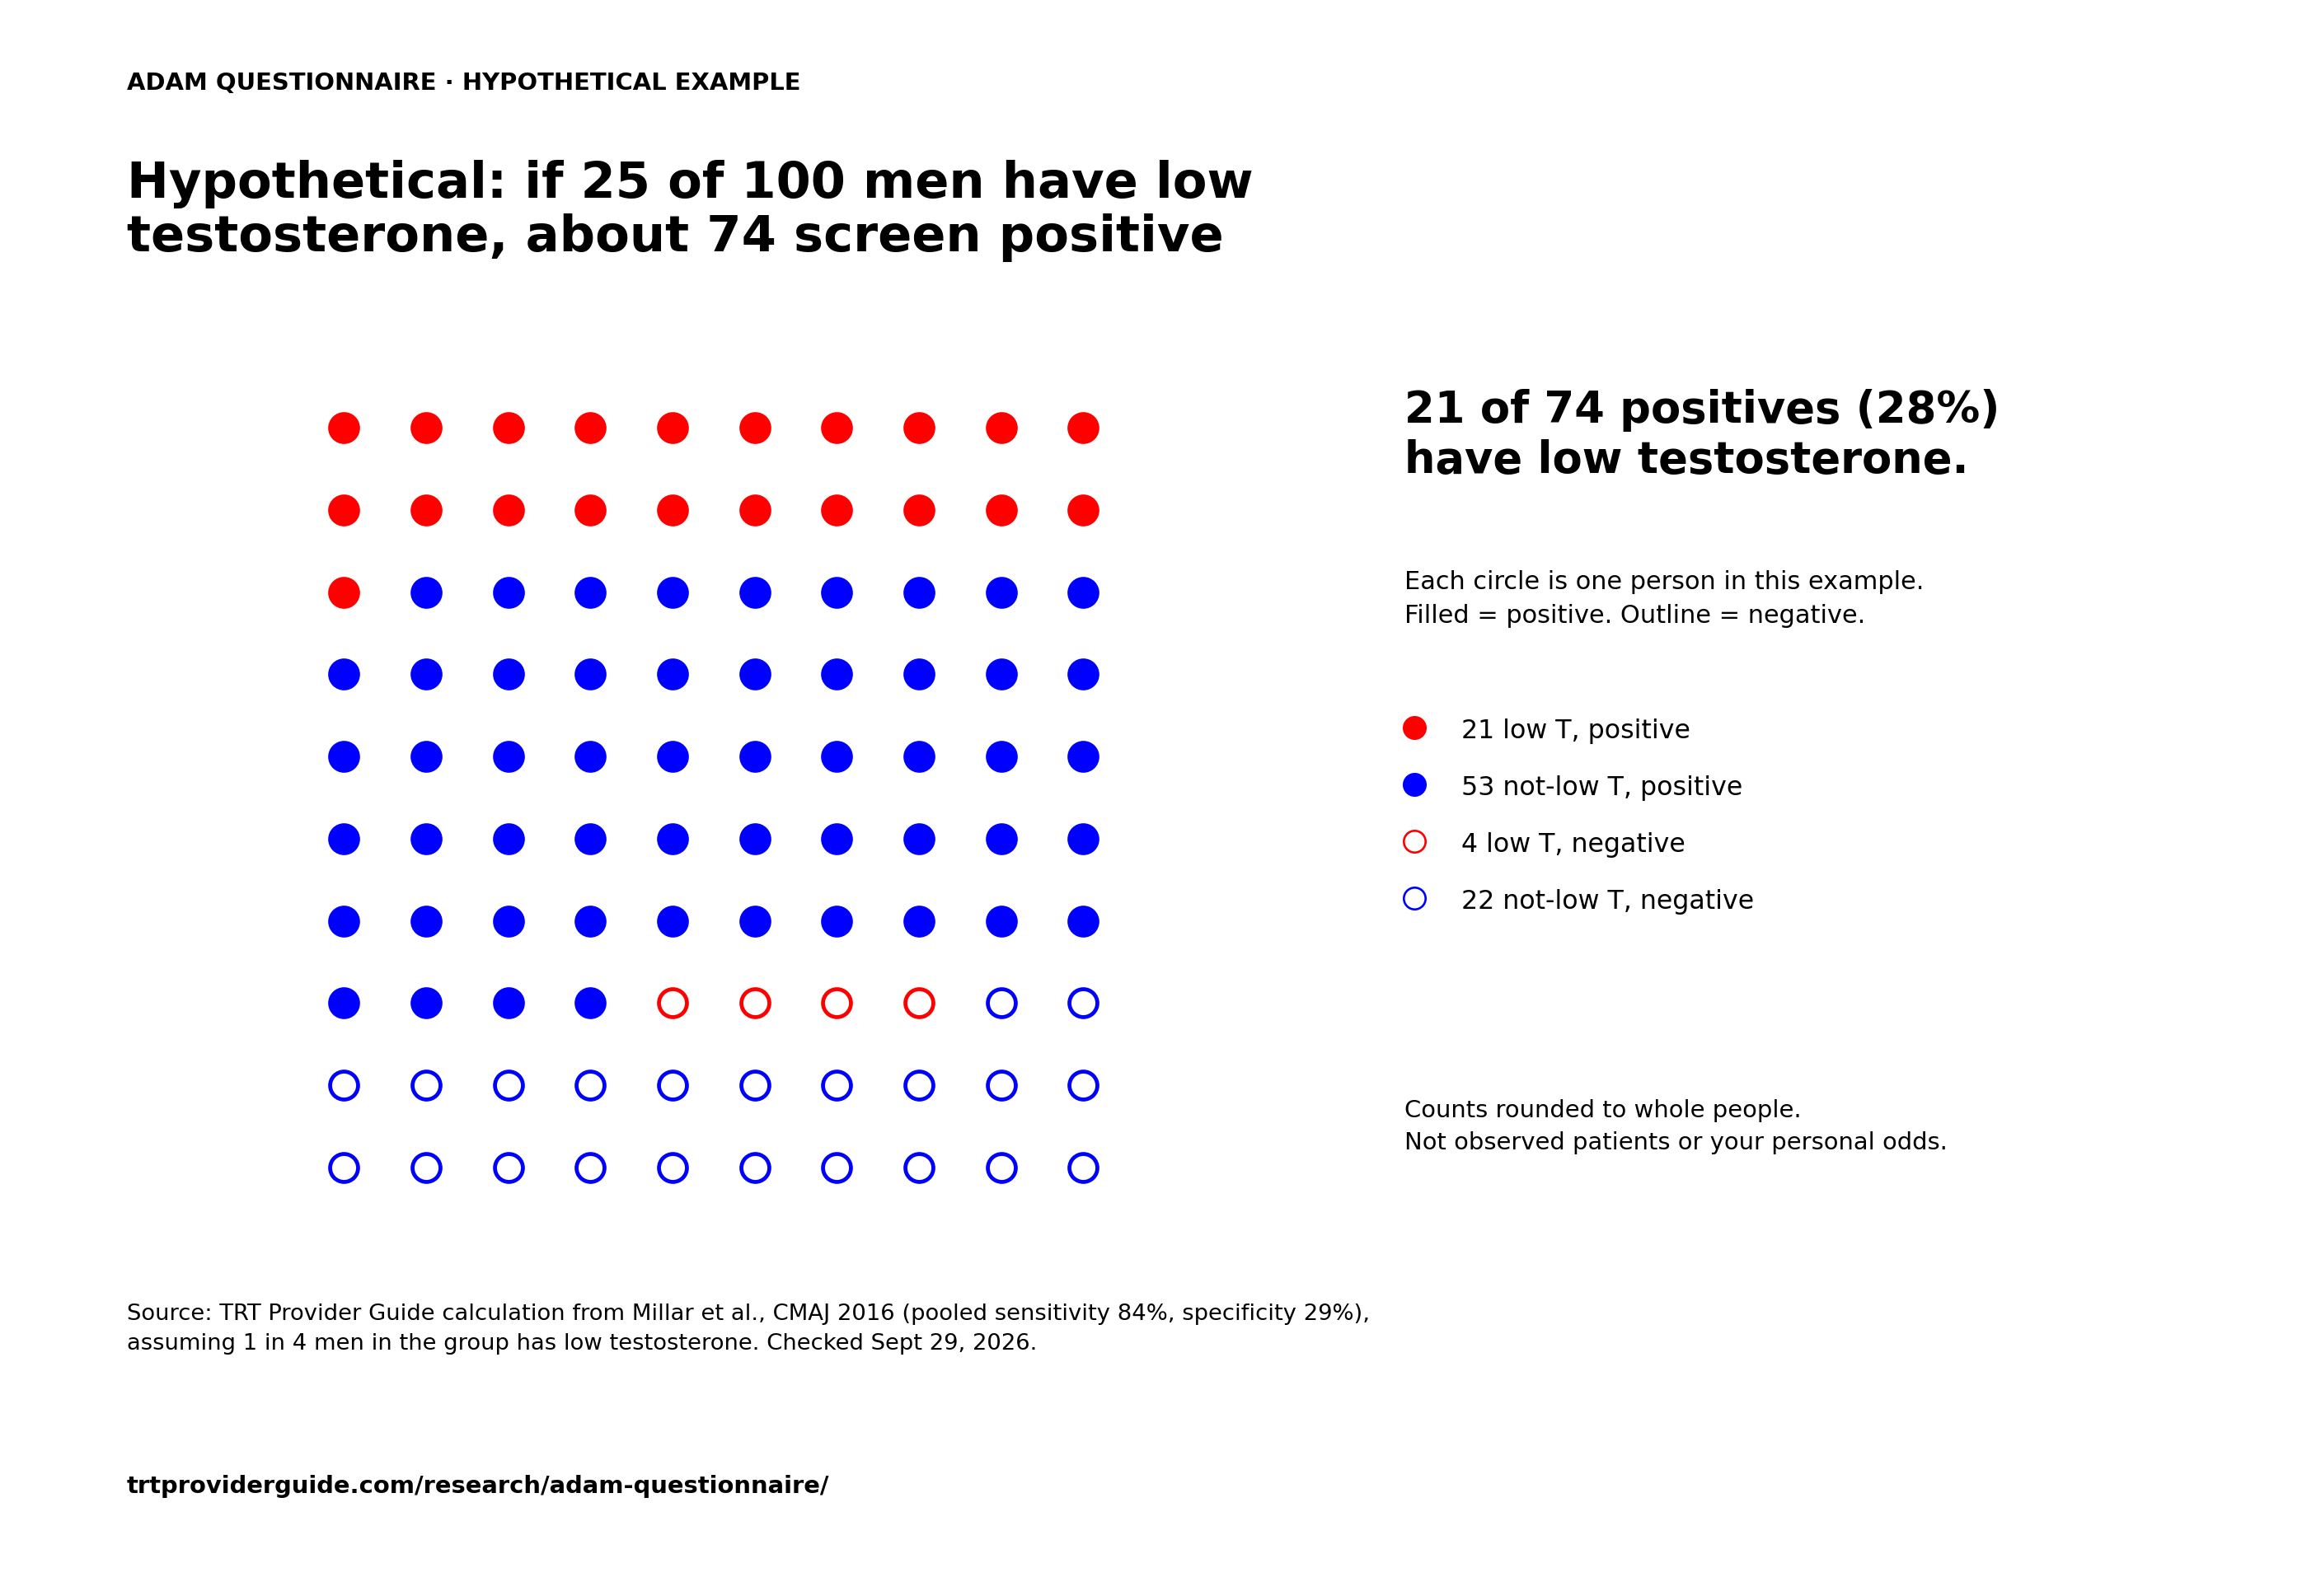
A negative lowers the odds, but it doesn't rule out low testosterone. In the hypothetical 100-man example above, about 4 of the 26 men who screened negative would still have low testosterone. Using the unrounded expected counts, that's 15.5% (4 ÷ 25.75), not a measured patient rate.
The pooled review put a number on how much a negative helps. Its negative likelihood ratio was 0.57. A likelihood ratio says how much a result shifts the odds: 1.0 means no change at all. The review's authors counted a ratio below 0.5 as clinically useful for ruling something out. The ADAM's 0.57 falls just short.
Source: Millar et al., CMAJ, 2016, Table 2.
Do other questionnaires, or single questions, do better?
Some had higher reported ratios, but these were not all tested head-to-head in the same men. In a 2016 review of 40 studies, a single question about low sex drive had a positive likelihood ratio of 1.6, compared with 1.2 for the full 10-question ADAM. The review's authors counted a ratio above 2.0 as clinically useful and judged the overall questionnaire evidence too weak for diagnosis. ANDROTEST reached 2.2 in one of its two studies, so it is not true that every estimate was below that bar.
A positive likelihood ratio says how much a positive result raises the odds of low testosterone. At 1.2, a positive ADAM barely moves them.
| Tool or symptom | Studies (men) | Sensitivity | Specificity | Positive likelihood ratio | Negative likelihood ratio |
|---|---|---|---|---|---|
| ANDROTEST questionnaire | 2 (879) | 68–76% | 65–66% | 1.9–2.2 | 0.37–0.49 |
| ANDROX questionnaire | 2 (1,387) | 48–70% | 64–74% | 1.8–2.0 | 0.47–0.70 |
| Low sex drive (one symptom) | 10 (8,676) | 51% | 68% | 1.6 | 0.72 |
| AMS (Aging Males' Symptoms) scale | 5 (1,853) | 74% | 49% | 1.5 | 0.59 |
| Erectile dysfunction (one symptom) | 11 (6,918) | 52% | 67% | 1.5 | 0.83 |
| MMAS questionnaire | 2 (3,330) | 53–71% | 53–59% | 1.3–1.5 | 0.55–0.79 |
| ADAM questionnaire | 9 (8,327) | 84% | 29% | 1.2 | 0.57 |
Source: Millar et al., CMAJ, 2016, Table 2. Ranges shown for tools represented by 2 studies in that review. The ANDROTEST's range reaches 2.2 in one of its two studies; the authors still judged no questionnaire clinically useful.
One small study shows the same pattern up close. In Chile, question 1 alone caught 63.3% of low-testosterone men and cleared 66.7% of normal men. The full ADAM caught 83.3% but cleared only 19.7% (Blümel et al., Maturitas, 2009). These reported rates show the sensitivity–specificity trade-off. But the paper's abstract counts do not reconcile with its diagnostic rates, so this small example should not be treated as a verified patient-level comparison.
Is the ADAM the same as the qADAM?
No. The standard ADAM gives a yes-or-no result. The graded qADAM, published online in 2009 and in a 2010 journal issue, asks about the same 10 topics but rates each from 1 to 5, for a total from 10 (most symptoms) to 50 (fewest). The two scores can't be compared.
| Version | How it's scored | Result | What the evidence covers |
|---|---|---|---|
| Standard ADAM (Morley, 2000) | Yes to Q1 or Q7, or 3+ of the other 8 | Positive or negative | All 18 papers in Table 3 |
| Point tally (Tancredi, 2004) | 1 point per yes | 0 to 10 | 5,028 men; AUC 0.529 in the abstract and 0.519 in Results; not a percent-correct score |
| qADAM (Mohamed, 2009 online/2010 issue) | Each item rated 1 to 5 | 10 (most symptoms) to 50 (fewest) | 57 men; 34 had testosterone measured |
| Chinese short version (Chu, 2008) | 6 questions; positive at 2 or more | Positive or negative | 86% sensitivity, 40% specificity |
Sources: Morley 2000; Tancredi 2004; Mohamed et al., International Journal of Impotence Research, 2010; Chu 2008.
A score of 38 fits the 10–50 qADAM scale, not standard ADAM. A "positive" result could come from standard ADAM or a short version. Check which one before you compare. The original graded-qADAM report involved 57 men awaiting prostate-cancer surgery, with testosterone measured in 34; its authors said those correlations did not by themselves validate the tool.
What do medical guidelines say about the ADAM?
They say not to diagnose from a questionnaire. The Endocrine Society diagnoses low testosterone only with matching symptoms plus unequivocally and consistently low testosterone on repeat morning fasting blood tests. The European Association of Urology's 2026 guidelines say questionnaires shouldn't be used for systematic screening because their specificity is poor.
| Group (year) | What it says |
|---|---|
| Endocrine Society (2018) | Diagnose hypogonadism only with symptoms and signs plus unequivocally and consistently low testosterone; confirm with a repeat morning fasting total-testosterone test. Otherwise healthy men don't need screening. |
| European Association of Urology (2026) | Questionnaires can help describe symptoms, but their specificity remains poor; do not use them for systematic screening or as a diagnosis on their own. |
| ISA, ISSAM, EAU, EAA and ASA joint recommendations (2008–2009) | The AMS and ADAM are not recommended for diagnosing hypogonadism because of low specificity. The ADAM's creator, John E. Morley, is one of the authors. |
| International Consultation on Sexual Medicine (2024 consultation, published 2025) | Screening questionnaires have good sensitivity but aren't effective for diagnosis; the ADAM and AMS aren't significantly associated with total testosterone levels. |
Source: the linked documents, checked September 29, 2026.
Which ADAM sources get the details wrong?
We checked ADAM sources against the originals and found 18 errors or internal conflicts in 11 sources. Two can directly change a score: a 2010 journal table prints the rule wrong, and a clinic PDF raises the bar from "3" to "more than 3."
| # | Source | What it says | What the source check shows |
|---|---|---|---|
| A1 | Ther Adv Urol 2010;2(3):99-104, Table 1 | Positive if yes to questions 1 AND 7, plus 2 to 4 other items | Positive if yes to question 1 OR question 7 OR any 3 other questions |
| A2 | Ther Adv Urol 2010;2(3):99-104, Table 1 | Question 4: 'Have you lost weight?' | Question 4: 'Have you lost height?' |
| A3 | Clinic questionnaire PDF (Men's Health Melbourne) | Positive if yes to 1 or 7, or yes to MORE THAN 3 questions | Any 3 other yes answers are enough; the 'more than 3' wording flips 56 of 1,024 possible answer patterns from positive to negative |
| A4 | Chueh et al., J Androl 2012 (discussion) | Chu 2008's ADAM questionnaire: 86% sensitivity, 40% specificity | Chu 2008: full ADAM 88%/32%; 86%/40% belongs to a 6-question short version |
| A5 | Naz et al., Cureus 2020 (discussion) | Chu et al.: 86% sensitivity, 40% specificity | Same as A4 |
| A6 | Naz et al., Cureus 2020 (abstract vs results) | Abstract: specificity 41.3% | Results table: 47.31%; the paper's own counts (79 of 167) give 47.31% |
| A7 | Naz et al., Cureus 2020 (text vs table) | 168 participants screened positive | The accuracy table's positive cells add to 161 (73 + 88), from 248 men, not 255 |
| A8 | Ugwu & Ikem, JEMDSA 2017 (abstract) | Abstract:200 men,142 ADAM-positive,59 low,PPV 50.0% | Table 4 cells 52/52/7/42 total 153, with 104 positive; PPV 52/104=50.0% is reproducible only within that table. The discrepancy with 200/142 is unexplained. |
| A9 | Tancredi 2004: abstract versus Results | Tally AUC 0.529 in abstract | Results give 0.519. Both describe discrimination, not the percentage correctly classified. |
| A10 | Tancredi 2004: Table 3 | Group headers 1939 low and 3088 normal | Headers sum 5027, not the reported full sample 5028; do not invent a missing patient. |
| A11 | Chueh 2012: Table 2 | Combined-criterion low group header 56 | The published cells 36+18 give 54 low and 339 total. |
| A12 | Cabral 2014: abstract, Results, Table 6 | Abstract 460 and 73.6/31.9; Results also 465; Table 6 prints 73.45/31.75 and 51.07 PPV | Table 6 cells 166/159/60/74 total 459: sensitivity 73.45%,specificity 31.76%,PPV 51.08% after ordinary two-decimal rounding. Keep source versions separate. |
| A13 | Blumel 2009: original abstract | 27 of 96 low;78 of 96 positive; sensitivity 83.3%,specificity 19.7% | The counts and performance rates do not form one consistent diagnostic table. Prevalence is 27/96=28.1%; no PPV inferred. |
| A14 | Zhou 2020: survey 2 total-T, Tables 2 and 4 | Table 2 low-T count 60; Table 4 sensitivity 89.83%,specificity 9.04% | Table 4 rates imply 59 low cases, not 60. Do not present an inferred 54/858 or 53/858 PPV as verified. |
| A15 | Naz 2020: Methods | Total-testosterone threshold below 8 mmol/L | Results use nmol/L. The numeric cutoff has an unresolved unit error; this review does not silently replace the unit. |
| A16 | Naz 2020: Discussion | Describes the Ugwu study as conducted in Kenya | Ugwu and Ikem studied men in Ile-Ife, Nigeria. |
| A17 | Adami 2025: Methods | 38 men enrolled;34 completed ADAM; another sentence says 34 of 37 | Use 34 as questionnaire analysis sample; do not present 38 as the number with both questionnaire and laboratory results. |
| A18 | Iranian translation 2021: Methods and Results | 2.20 cutoff, conflicting testosterone units, and unclear ROC direction | The paper explicitly calls 2.20 a testosterone cutoff. It is not evidence of a modified ADAM score. Reported 93.85/77.14 are retained with methodological limits, not recoded as validated patient counts. |
Source: the linked originals, checked September 29, 2026. Conflicts are recorded as conflicts; no corrected patient record is assumed.
These details change some counts and claims. They are a reason to name the table, sample and questionnaire version when citing a result. A published number can be quoted as reported without pretending that conflicting parts of the paper have been resolved.
What should you do after a positive ADAM result?
Treat it as a prompt to discuss your symptoms and whether testing is appropriate, not as an answer. The Endocrine Society's standard is matching symptoms plus low testosterone confirmed on a repeat early-morning fasting blood test. A questionnaire can't replace that step.
Here's where to go next on this site:
- How low testosterone is actually confirmed, including why it takes two morning blood tests.
- Why one blood result can mislead, in our research on testosterone test accuracy.
- What a testosterone blood test costs if you're paying yourself.
- What you'd have to show to qualify for TRT, which a questionnaire alone never covers.
- How a blood result compares once you have one, in our testosterone levels by age reference.
How we built this
On September 29, 2026, we checked original abstracts, accessible full papers and journal sites, then searched for additional reports. The evidence ledger now includes 18 papers published from 2000 to 2025, plus a separate pooled review (CMAJ, 2016). This is a targeted source review, not a systematic search or a claim to include every ADAM paper.
For each report, we recorded who was tested, the sample behind the selected comparison, the blood-test definition, and the reported sensitivity and specificity. We selected the featured whole-ADAM comparison in each paper. For Cabral, we used the published Table 6 cells and preserved the conflicting abstract in a separate row. Zhou contributes its first survey's total-testosterone comparison. The 32-row CSV also keeps the verified alternate cutoffs and source versions; these are not counted as extra papers.
The Iranian 2021 paper calls 2.20 a testosterone cutoff, not a new ADAM score. We retain the authors' 93.85% sensitivity and 77.14% specificity, flagged for unclear units and ROC direction. We also flag Lu's resampled benchmark. Neither is presented as a newly verified set of patient outcomes. Iranian report; Lu 2016.
We did not pool the reports. The median is the middle of the selected estimates, with each paper counted once. For 18 specificity values, the middle two are 30% and 31.76%: (30 + 31.76) ÷ 2 = 30.88%, shown as 30.9%. 16 values are below 50%. The middle sensitivity values are 86.5% and 87%, giving 86.75%, shown as 86.8%. These summaries do not remove the differences between the reports.
For Table 4, we used the same diagnostic group for each row. Counts were read directly where available; a few were reconstructed from published totals and rounded rates, as marked in the CSV. We did not solve new prevalence or predictive values from incompatible source figures. Tancredi's alternate cutoffs can produce different predictive values—including 65.3% at 90 ng/L—so the Table 4 range is a range of selected comparisons, not a ceiling for every ADAM result. Tancredi, Table 4.
The six-question Chinese short form and the graded qADAM are described separately, not mixed into the main table. We also exclude a paper published online in 2019, in a 2020 issue that asked the reverse question: how well blood tests predict ADAM status.
The CSV's verification_depth and source_locator fields show what was actually checked. Some rows could be checked only against the original abstract; missing ages, dates and cutoffs remain unavailable. Full-text access allowed additional checks of counts, methods and conflicts. We did not obtain patient-level data or contact the authors to resolve discrepancies.
We also re-scored all 1,024 complete answer patterns, once under the published rule and once under the incorrect "more than 3" wording. The results are 37 negative, 987 positive, and 56 changed by that wording error. We separately checked the specified incomplete-answer logic across 59,049 possible yes/no/unanswered input states. This verifies the logic, not a live website's implementation or privacy behavior.
We didn't recruit anyone, run a survey, or measure anyone's testosterone. This is a review of published work plus our own arithmetic.
What this data does and doesn't show
It shows the reported ADAM performance in 18 papers, how often a positive held up on a blood test, and exactly how the scoring rule behaves.
It doesn't show your personal odds. Your chance depends on your age, your health, and which blood test and cutoff your clinician uses. It doesn't say which testosterone cutoff is "right." And none of this means your symptoms aren't real. Tiredness, low mood and low sex drive are real problems with many possible causes, and low testosterone is only one of them.
A few more limits:
- The papers span 2000 to 2025, in different languages, countries and clinics.
- Several are small. Blümel 2009 tested 96 men.
- One study (Tancredi 2004, 5,028 men) is bigger than the next four combined.
- Several papers contain figures or methods that do not agree. The source audit identifies each issue. A median does not fix those conflicts or prove that a questionnaire performs the same way in another group.
How to cite this page
TRT Provider Guide. "ADAM Questionnaire: Scoring Rule and Accuracy Across 18 Papers." TRT Provider Guide Research & Data. Updated September 29, 2026. https://trtproviderguide.com/research/adam-questionnaire/
Dataset:
TRT Provider Guide. ADAM Evidence Ledger, version 2026-09-29. https://trtproviderguide.com/research/adam-questionnaire/data/adam-questionnaire-evidence-ledger-2026-09-29.csv
For a single study's result, cite that study. For the 18-paper comparison, the medians, the scoring audit or the source audit, cite this page.
Reuse: You're welcome to reuse our tables, charts, calculations, scoring audit and datasets with credit to TRT Provider Guide. Please keep the credit to each study's authors for their data. This permission covers only our original compilation, explanations and calculations. Third-party questionnaire wording and other source material keep their own rights and license terms; they are not covered by this note. Credit by name is enough; no link is required.
Download the data
- ADAM Evidence Ledger (CSV): 18 main report rows, 13 alternate comparisons or source versions, and the pooled review. 32 rows.
- ADAM Source Audit (CSV): the 18 errors and conflicts in Table 10.
- ADAM Scoring Patterns (CSV): all 1,024 possible answer patterns, scored. These are made-up test cases, not patient data.
- Charts: specificity by study (PNG) · positive rate by age (PNG) · 100-men example (PNG). SVG versions sit beside each PNG.
- Age-rate chart data (CSV): counts and rates for all 8 rows in Table 5.
- Hypothetical-group chart data (CSV): unrounded calculations behind Table 6 and the icon chart.
- Other questionnaires and symptoms (CSV): the 7 rows in Table 7, including which values are ranges rather than pooled estimates.
Frequently asked questions about the ADAM questionnaire
What is the ADAM test?
The ADAM test is a 10-question, yes-or-no symptom questionnaire for low testosterone, published by Saint Louis University researchers in 2000. It's positive if you answer yes to question 1 (sex drive) or question 7 (erections), or to any 3 others. It's a screen, not a blood test, so it can't diagnose low testosterone.
How do you score the ADAM questionnaire?
Answer yes to question 1 or question 7, or yes to at least 3 of the other 8, and the result is positive. With all 10 answers complete, anything else is negative. Put more simply: any 3 yes answers are always positive, and 1 or 2 yes answers are positive only if one of them is question 1 or 7.
Is one yes answer enough for a positive ADAM?
Only if it's question 1 or question 7. Of the 10 ways to answer yes to exactly one question, 2 are positive. A single yes to any other question is negative.
Is an ADAM score of 2 normal?
A total of "2" does not determine the standard ADAM result. Two yes answers can go either way. Of the 45 possible pairs, 17 are positive (they include question 1 or 7) and 28 are negative.
How accurate is the ADAM questionnaire?
In 16 of 18 papers reviewed here, the selected specificity result was below 50%. The median sensitivity was 86.8%, and median specificity was 30.9%; these summarize report values, not one patient group. The separate 2016 pooled review found 84% sensitivity and 29% specificity across 9 ADAM studies. Evidence and sources.
Does a positive ADAM mean I have low testosterone?
No. In 11 selected comparisons with a reported or reproducible predictive value, a median 38.7% of positive screens were below that paper's blood-test cutoff. Discuss your symptoms with a clinician, who can decide whether testing is appropriate. A diagnosis needs compatible symptoms and consistently low testosterone, not a quiz result. Evidence; Endocrine Society guidance.
Can a negative ADAM rule out low testosterone?
No. A negative lowers the odds but not by much. In a hypothetical group where 1 in 4 men has low testosterone, 15.5% of those who screen negative would still have it, using the pooled review's point estimates. That is an example, not your personal probability. Worked calculation.
Where can I find the ADAM questionnaire PDF?
The exact wording is reprinted, with the authors' permission, in a 2003 Reviews in Urology table on PubMed Central. The Tancredi full paper also includes the questionnaire in Table 1, on PDF page 3. If you use a printable version from anywhere else, check its scoring line. At least one clinic PDF says "more than 3," which is wrong.
What's the difference between the ADAM and the qADAM?
The standard ADAM gives a positive or negative result from yes-or-no answers. The graded qADAM, published online in 2009 and in a 2010 journal issue, rates each of the same 10 topics from 1 to 5, for a total from 10 (most symptoms) to 50 (fewest). The two can't be compared directly.
Who created the ADAM questionnaire?
John E. Morley and colleagues at Saint Louis University created it. They published the first validation in the journal Metabolism in September 2000, testing it in 316 Canadian physicians.
Is the ADAM meant for men under 40?
It was built for older men. The original authors called it a reasonable screen for men over 40, and many reports here focused on men 40 and older. Others included younger adults; results from older or clinic samples do not establish how the screen performs for every man under 40.
Sources
Sources checked September 29, 2026. Verification depth varies: the evidence CSV identifies original-abstract checks, full-text checks and unresolved source conflicts.
- Morley JE, et al. Validation of a screening questionnaire for androgen deficiency in aging males. Metabolism. 2000;49(9):1239–1242.
- Saint Louis University ADAM questionnaire, Table 1 (reprinted with permission from Morley et al.). Reviews in Urology. 2003;5(Suppl 1):S11–S15.
- ClinicalTrials.gov. NCT01703741 results record (ADAM scoring definition).
- Tancredi A, et al. Interest of the ADAM questionnaire for the identification of hypogonadism in elderly community-dwelling male volunteers. European Journal of Endocrinology. 2004;151(3):355–360.
- Morley JE, et al. Comparison of screening questionnaires for the diagnosis of hypogonadism. Maturitas. 2006;53(4):424–429.
- Martínez-Jabaloyas JM, et al. Relationship between the Saint Louis University ADAM questionnaire and sexual hormonal levels in a male outpatient population over 50 years of age. European Urology. 2007;52(6):1760–1767.
- Chu LW, et al. A short version of the ADAM questionnaire for androgen deficiency in Chinese men. Journals of Gerontology, Series A. 2008;63(4):426–431.
- Goel A, et al. Andropause in Indian men: a preliminary cross-sectional study. Urology Journal. 2009;6(1):40–44.
- Blümel JE, et al. Is the ADAM questionnaire useful for the screening of partial androgenic deficiency of aging men? Maturitas. 2009;63(4):365–368.
- Rabah DM, Arafa MA. Validation of an Arabic ADAM questionnaire for androgen deficiency screening in the Arab community. Aging Male. 2009;12(4):95–99.
- Chueh KS, et al. The comparison of the AMS scale and ADAM questionnaire to detect androgen deficiency in middle-aged men. Journal of Andrology. 2012;33(5):817–823. Full text.
- Chen W, et al. Are the AMS scale and the ADAM questionnaire suitable for the screening of late-onset hypogonadism in aging Chinese men? Aging Male. 2013;16(3):92–96.
- Cabral RD, et al. Performance of MMAS and ADAM questionnaires in the prediction of free testosterone. Aging Male. 2014;17(3):147–154.
- Lu T, et al. Applying machine learning techniques to the identification of late-onset hypogonadism in elderly men. SpringerPlus. 2016;5:729.
- Ugwu TE, Ikem RT. Performance of the ADAM questionnaire in black sub-Saharan African men with type 2 diabetes mellitus. JEMDSA. 2017;22(1):1–4.
- Naz S, et al. Sensitivity, specificity and accuracy of the ADAM questionnaire in the male population in Pakistan. Cureus. 2020;12(11):e11788.
- Zhou SJ, et al. The epidemiological characteristics of late-onset hypogonadism in Chinese middle-aged and elderly men: two cross-sectional studies in the same community. American Journal of Men's Health. 2020;14(6).
- Millar AC, et al. Predicting low testosterone in aging men: a systematic review. CMAJ. 2016;188(13):E321–E330. PDF with Table 2.
- Mohamed O, et al. The quantitative ADAM questionnaire. International Journal of Impotence Research. 2010;22(1):20–24.
- Hypogonadism, ADAM, and hormone replacement, Table 1. Therapeutic Advances in Urology. 2010;2(3):99–104.
- Men's Health Melbourne. ADAM questionnaire PDF.
- Korean Journal of Urology. Serum total testosterone level and identification of late-onset hypogonadism: a community-based study. 2013;54(9):619.
- Bhasin S, et al. Testosterone therapy in men with hypogonadism: an Endocrine Society clinical practice guideline. Journal of Clinical Endocrinology & Metabolism. 2018;103(5):1715–1744.
- Endocrine Society. Experts issue recommendations to improve testosterone prescribing practices. 2018.
- European Association of Urology. Guidelines on Sexual and Reproductive Health, 2026 edition.
- Wang C, Nieschlag E, Swerdloff R, et al. (including Morley JE). Investigation, treatment and monitoring of late-onset hypogonadism in males: ISA, ISSAM, EAU, EAA and ASA recommendations. Published jointly in several journals, 2008–2009.
- Male hypogonadism: recommendations from the Fifth International Consultation on Sexual Medicine (ICSM 2024). Sexual Medicine Reviews. 2025;13(4):548.
- Ashghali-Farahani M, et al. Androgen deficiency in aging males: translation and validation study of the Iranian version. Iranian Journal of Nursing and Midwifery Research. 2021;26(2):144–149.
- Anupam B, et al. Association of total and calculated free testosterone with androgen deficiency symptoms in patients with type 2 diabetes. International Journal of Impotence Research. Online 2019; 2020;32:289–296.
- Waddankeri SS, et al. Androgen Deficiency in Aging Males (ADAM) Score as a Predictor of Total Testosterone Levels in Type 2 Diabetes Mellitus. Journal of the Association of Physicians of India. 2024;72(4):31–37. doi:10.59556/japi.72.0514.
- Adami GAV, et al. Assessing testosterone levels in men with type 2 diabetes: a cross-sectional study in primary care. Arquivos de Ciências da Saúde da UNIPAR. 2025;29(2):752–765. Full paper.
- Cabral RD, et al. Author-posted full article, Tables 5 and 6. Same 2014 paper as source 13; not an extra study.
- Ugwu TE, Ikem RT. Author-posted full article, Table 4. Same 2017 paper as source 15; not an extra study.
- Tancredi A, et al. University-repository full paper, Tables 3 and 4. Same 2004 paper as source 4; not an extra study.
TRT Provider Guide Research & Data is the research and reference section of trtproviderguide.com.